In a prior blog post, we saw how to add API traffic badges (shields) to your API Service description providing a better user experience for your API Governance team. This capability leverages the Amplify Central Traceability APIs that provide API traffic data.
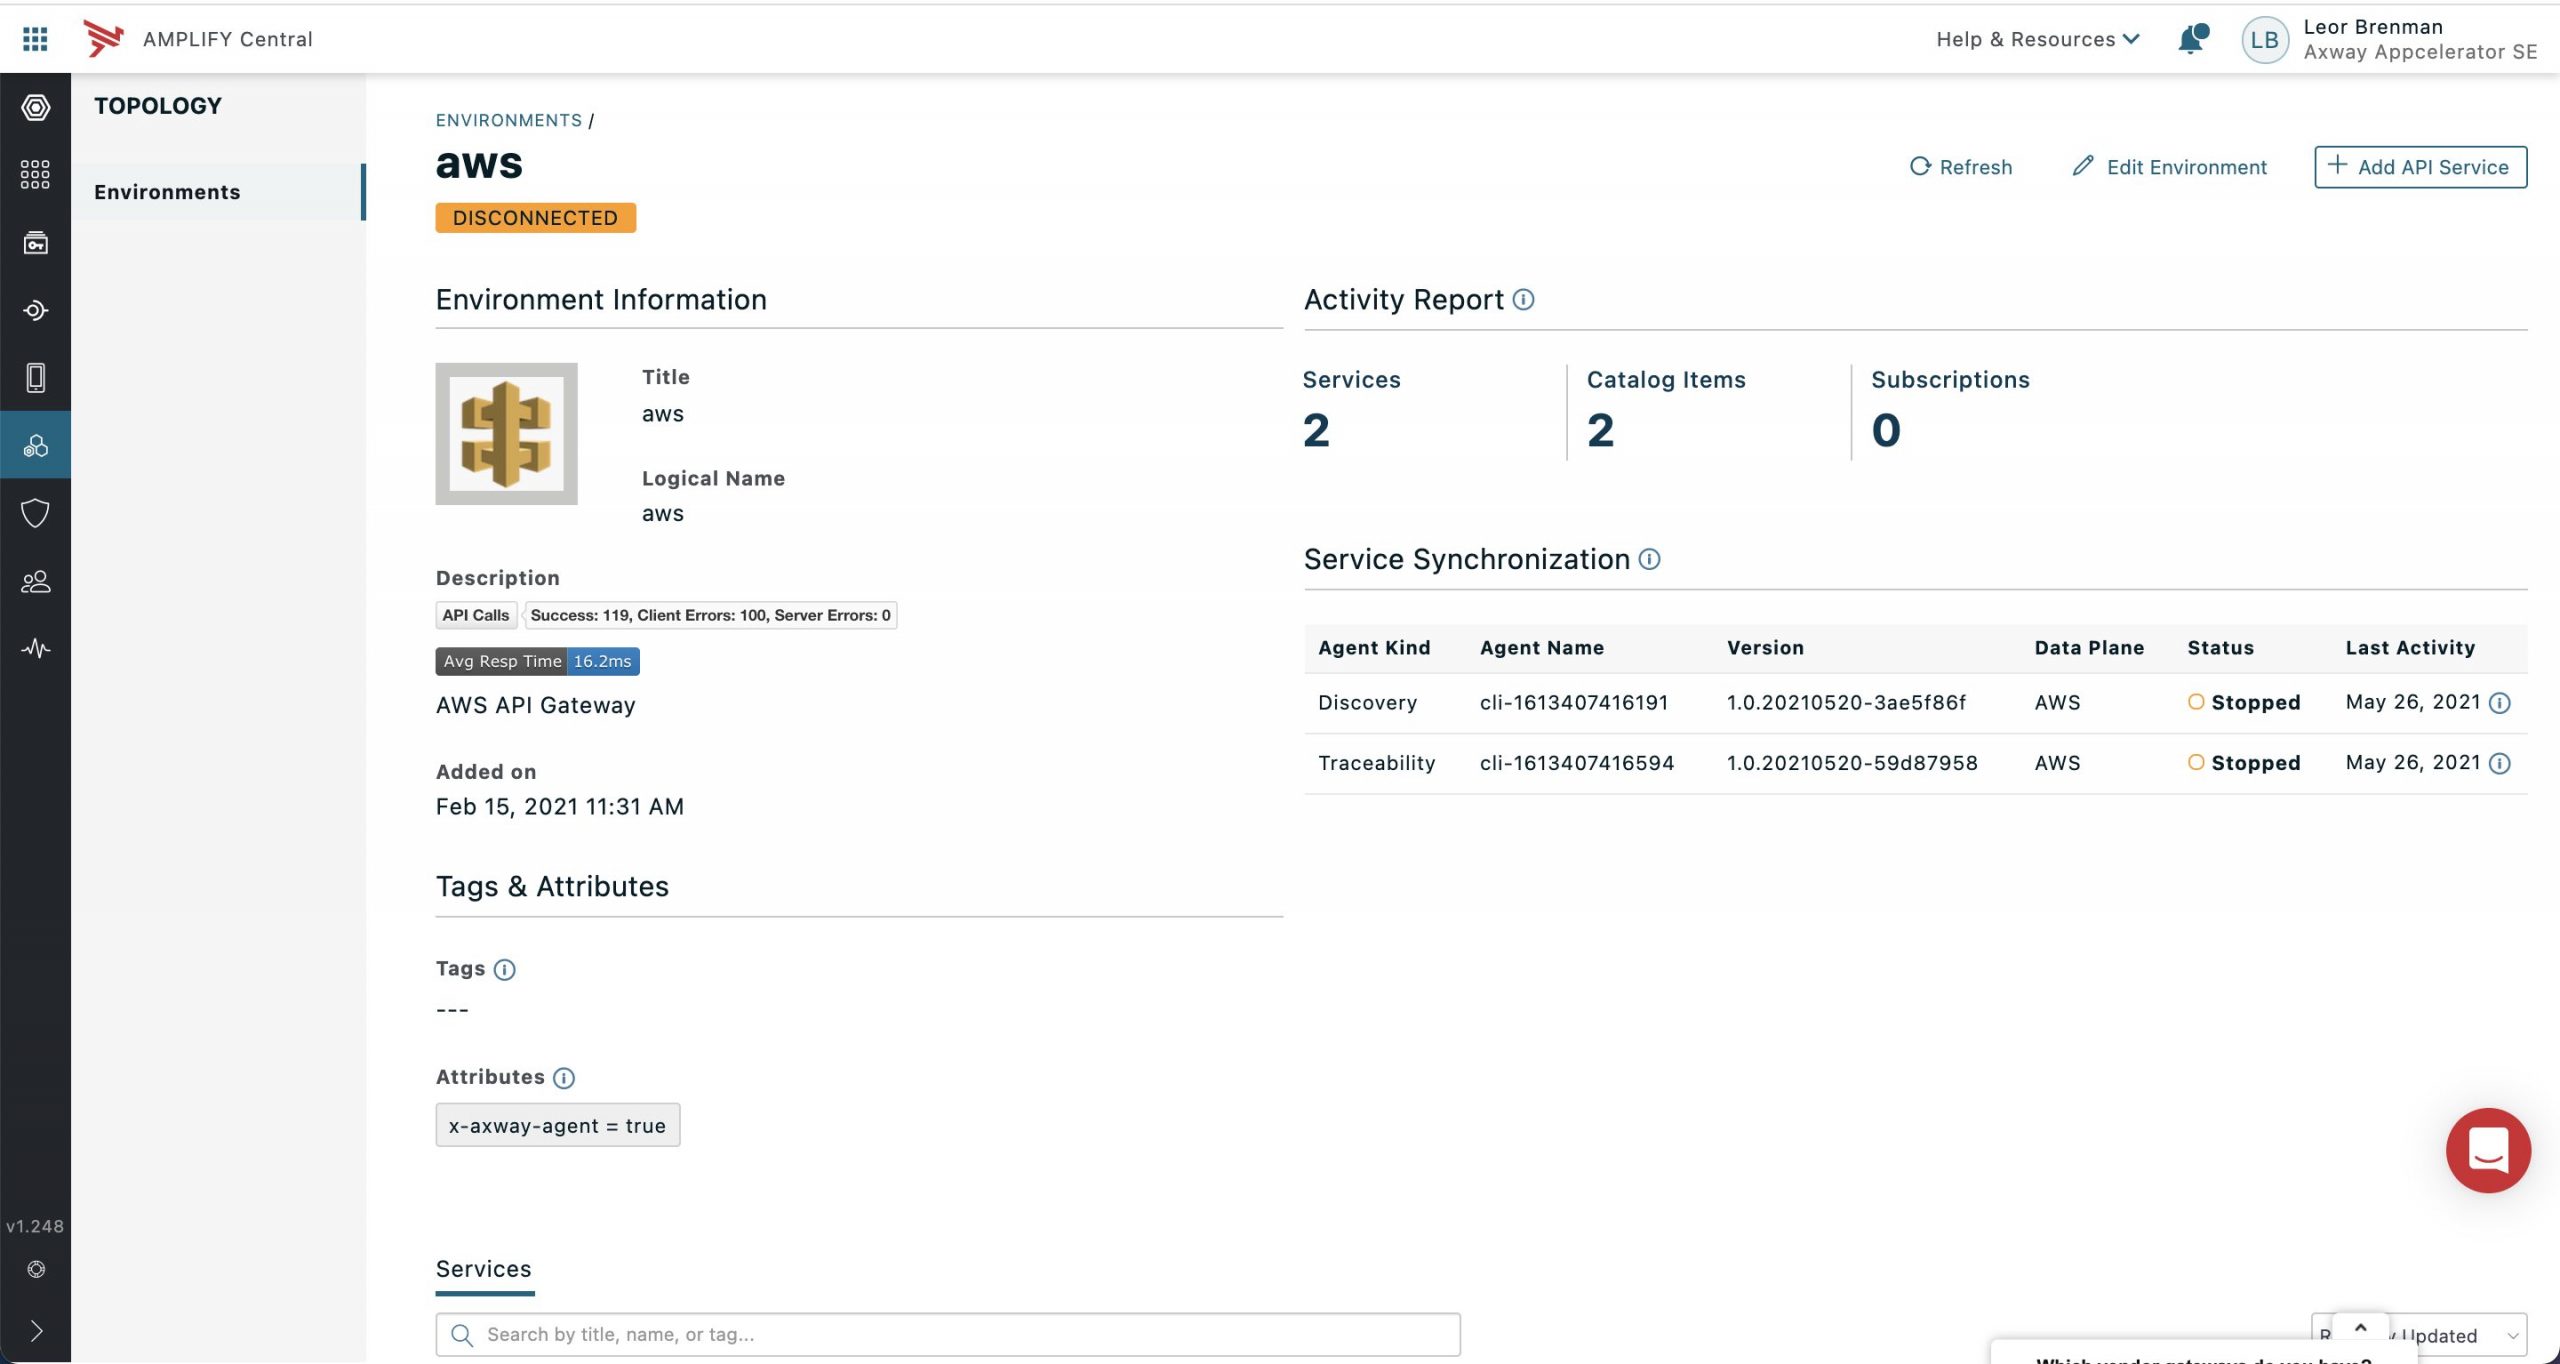
In this blog post, we’ll leverage the traceability API to add summary API traffic badges to your environment description. Again, this makes it easier for the API Governance team to assess quickly API traffic and focus on their efforts. An example is shown below:

Note that the API Traffic summarizes all API traffic for APIs in the environment
Without these shields, the API Governance team would need to navigate to the API Observer tab in Central and select the environment, and set the date range as shown below:
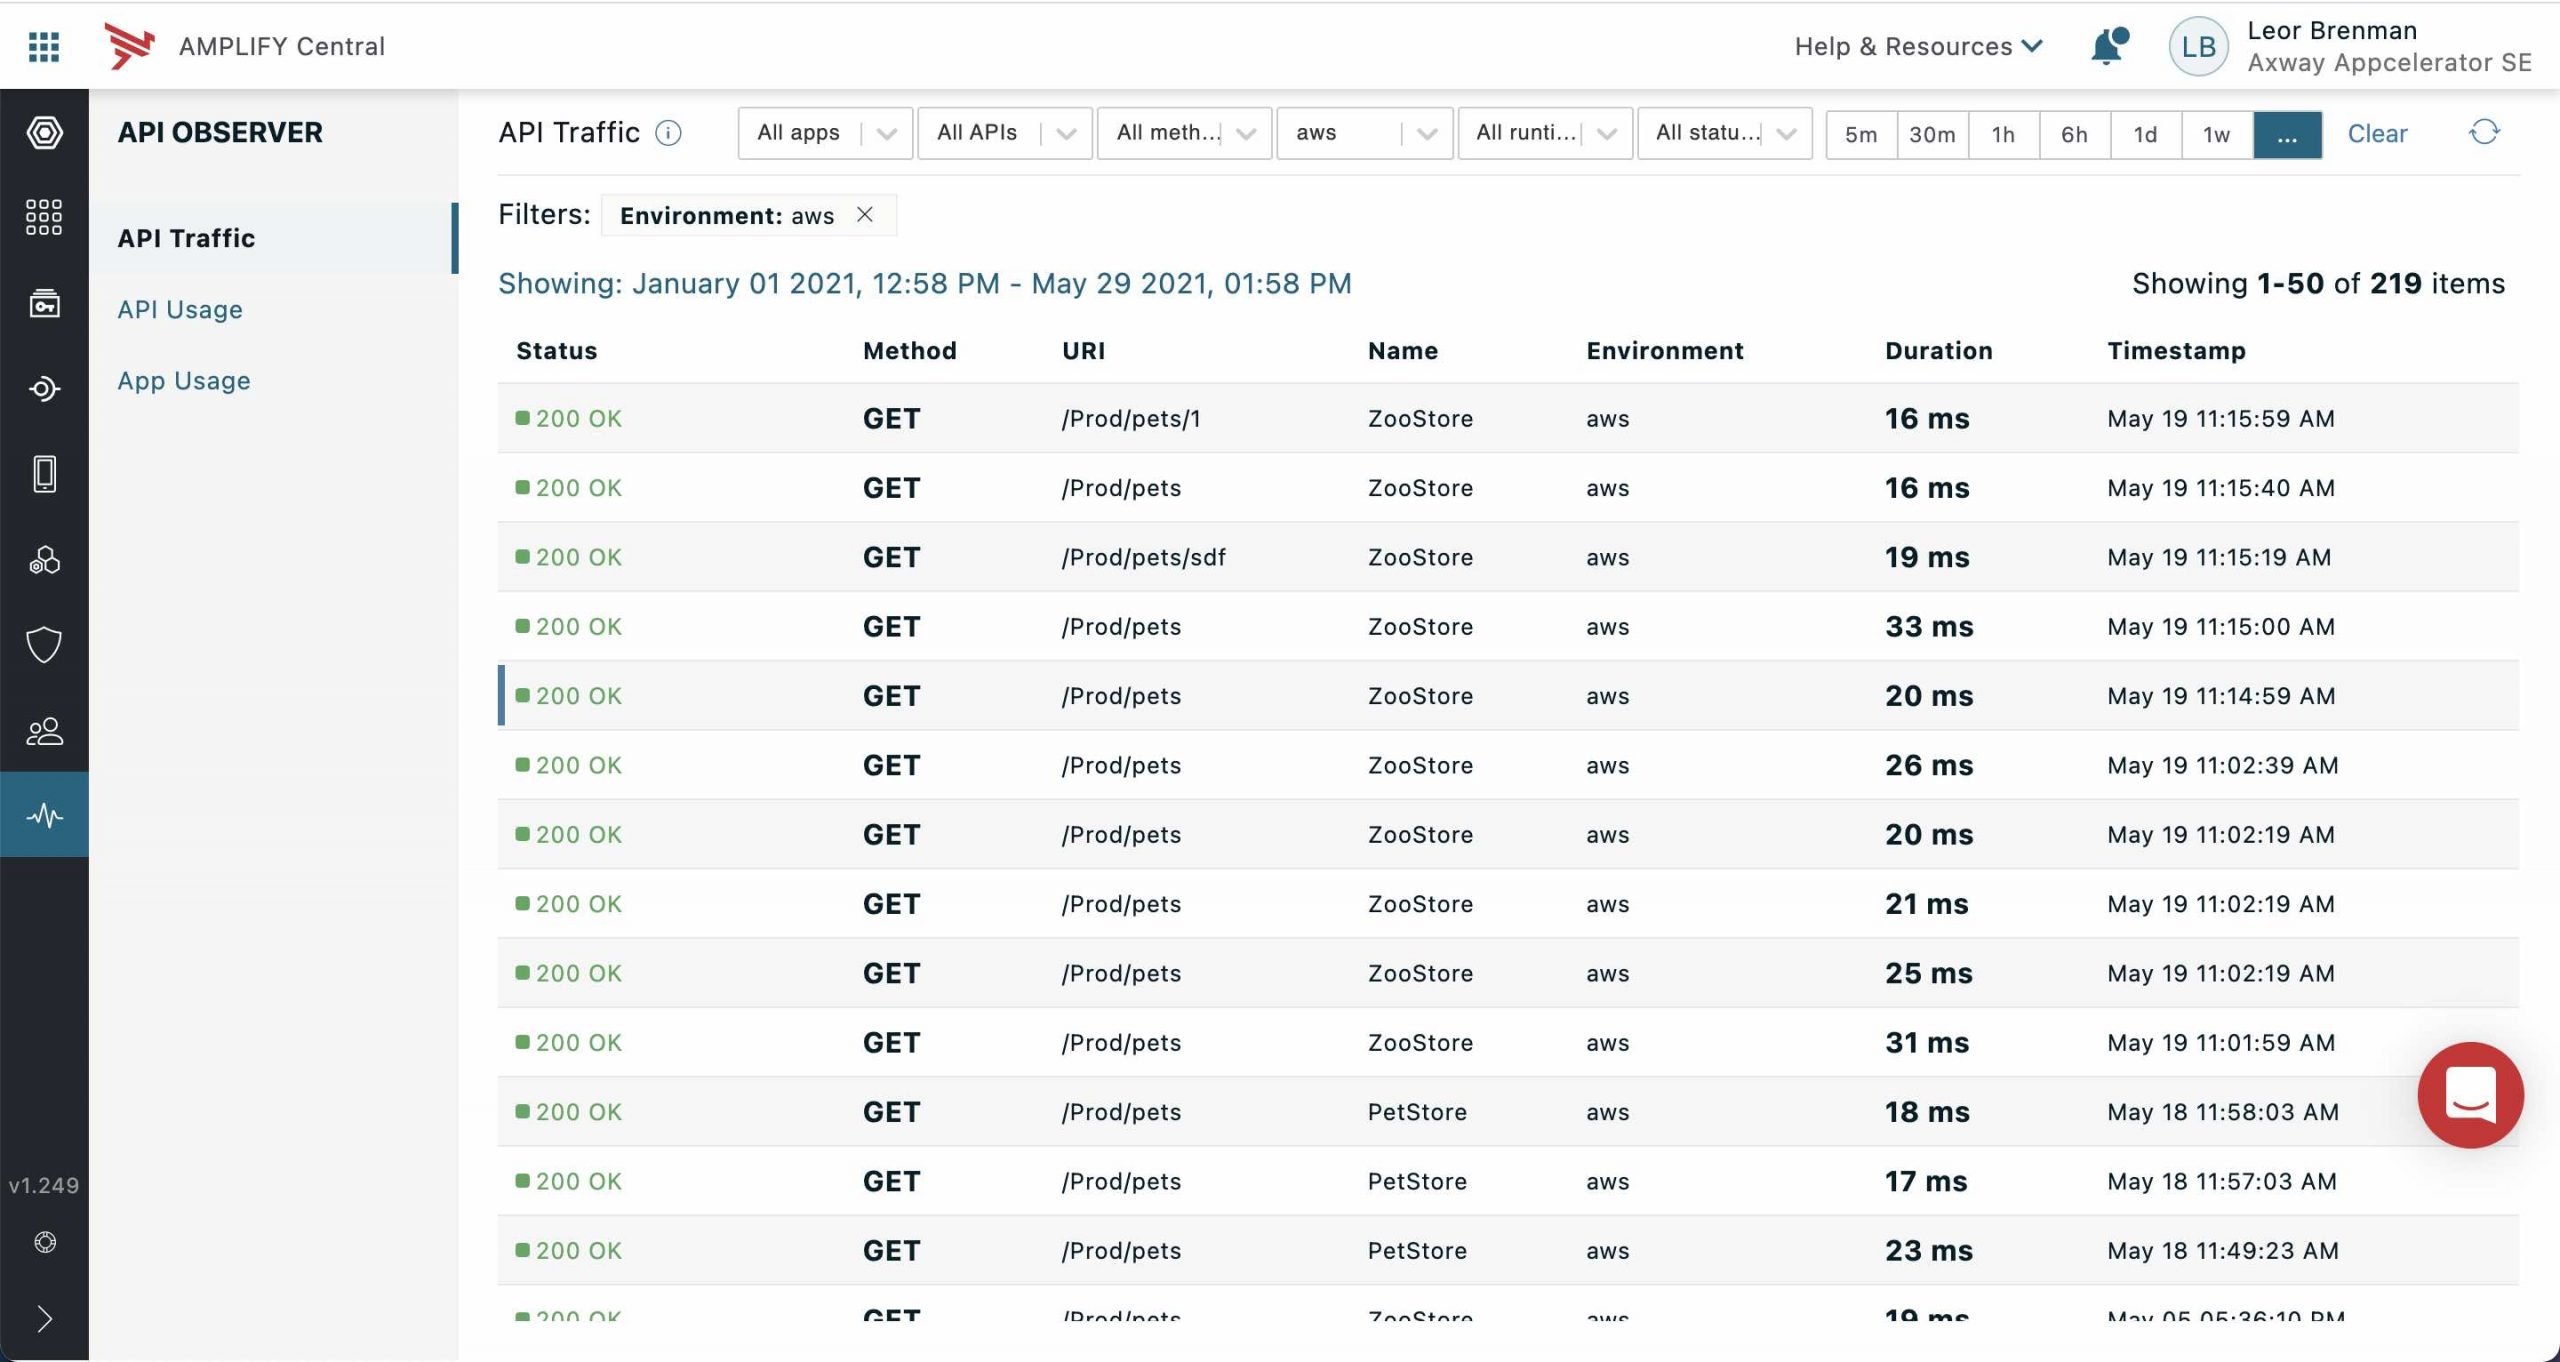
Having these badges eliminates the need to do this and saves time and effort.
In the prior post, we saw how we could leverage Central Integration Webhooks and an API Builder service to add automatically the shields to our API Service. This is useful since each environment may have many APIs and manually adding the shields could become unwieldy. In this case, for environment API traffic metrics, we’ll simply add the shields manually since there is usually only a handful of environments.
Traceability APIs
Our API Builder service will use the same traceability API that we used in the prior blog post, but we will modify the body in order to get summary data for an environment.
The Amplify Central Traceability API swagger docs can found here.
The underlying traceability API is shown below:
POST /traceability/search
In order to get the API Call stats, we use the following body:
{
  "filters": {
    "$and": [
      {
        "$match": {
          "type": [
            "transactionSummary"
          ]
        }
      },
      {
        "$match": {
          "environmentId": [
            "8a2e862d779860e20177a6888d450233"
          ]
        }
      }
    ],
    "$range": {
      "@event_time": {
        "gt": 0,
        "lt": now.getTime()
      }
    }
  },
  "invoke": {
    "field": "@event_time",
    "method": "count"
  },
  "group_by": [
    {
      "field": "transactionSummary.status",
      "type": "string"
    }
  ],
  "version": "0.2"
}
which returns:
{
    "Success": 119,
    "Failure": 100,
    "Exceptions": 22
}
For the API average response time, the traceability API body is:
{
  "filters": {
    "$and": [
      {
        "$match": {
          "type": [
            "transactionSummary"
          ]
        }
      },
      {
        "$match": {
          "environmentId": [
            "8a2e862d779860e20177a6888d450233"
          ]
        }
      }
    ],
    "$range": {
      "@event_time": {
        "gt": 0,
        "lt": now.getTime()
      }
    }
  },
  "invoke":
    {
        "field":"transactionSummary.duration",
        "method":"avg"
    },
  "version": "0.2"
}
and it returns the average response time in ms, e.g. 16.182648401826484.
Use the Axway Central API to Get your Environment ID
As shown above, in order to add the API Traffic shields you will need your environment id. You can get that using the Axway CLI as follows:
axway central get env
Response:
✔ Resource(s) successfully retrieved

NAME       AGE           TITLE                 RESOURCE KIND
aws        3 months ago  aws                   Environment
v7b        3 months ago  v7b                   Environment
v7a        3 months ago  v7a                   Environment
manualenv  2 months ago  Manual Environment    Environment
mulesoft   a year ago    mulesoft Environment  Environment
So, if we want to create shields for the aws environment, let’s get the environment details using the following:
axway central get env aws -o json
Response:
{
    "group": "management",
    "apiVersion": "v1alpha1",
    "kind": "Environment",
    "name": "aws",
    "title": "aws",
    "metadata": {
        "id": "8a2e862d779860e20177a6888d450233",
        "audit": {
            "createTimestamp": "2021-02-15T16:31:42.917+0000",
            "createUserId": "789f8247a10c466f36894f0f3cfdce19",
            "modifyTimestamp": "2021-04-30T15:28:04.047+0000",
            "modifyUserId": "DOSA_bc298f7496ad4fbe9d0ae5627bef9a56"
        },
        "resourceVersion": "93429",
        "references": [],
        "selfLink": "/management/v1alpha1/environments/aws"
    },
    "attributes": {
        "x-axway-agent": "true"
    },
    "finalizers": [],
    "tags": [],
    "spec": {
        "icon": {
            "data": "iVBO...kJggg==",
            "contentType": "image/jpeg"
        }
    }
}
The environment id is metadata.id. In this case it’s 8a2e862d779860e20177a6888d450233.
You will need to do this for each environment that you want to add API traffic shields to.
API Builder API Calls
The API Builder project, described in the prior post, was modified to add a new API for our shields, /envmetrics. It takes two query parameters:
- eid – environment id
- metrictype – the metric type:
- envcallmetrics – summary success, fail, exception
- envavgresptime – average response time
The API Builder API call to get API stats for environment aws is:
GET {{apib_baseaddress}}/api/envmetrics?eid=8a2e862d779860e20177a6888d450233&metrictype=envcallmetrics
with response:
{
  "schemaVersion": 1,
  "label": "API Calls",
  "message": "Success: 119, Client Errors: 100, Server Errors: 0",
  "color": "red"
}
The API Builder API call to get the Average Response Time for environment aws is:
GET {{apib_baseaddress}}/api/envmetrics?eid=8a2e862d779860e20177a6888d450233&metrictype=envavgresptime
with response:
{
  "schemaVersion": 1,
  "label": "Avg Resp Time",
  "message": "16.2ms",
  "color": "blue"
}
The API Builder project can be found here. A docker container version of it can be found here.
Shields URL
In order to get the shields URL, take the API Builder URLs and paste them into the Shields.io endpoint form as follows:
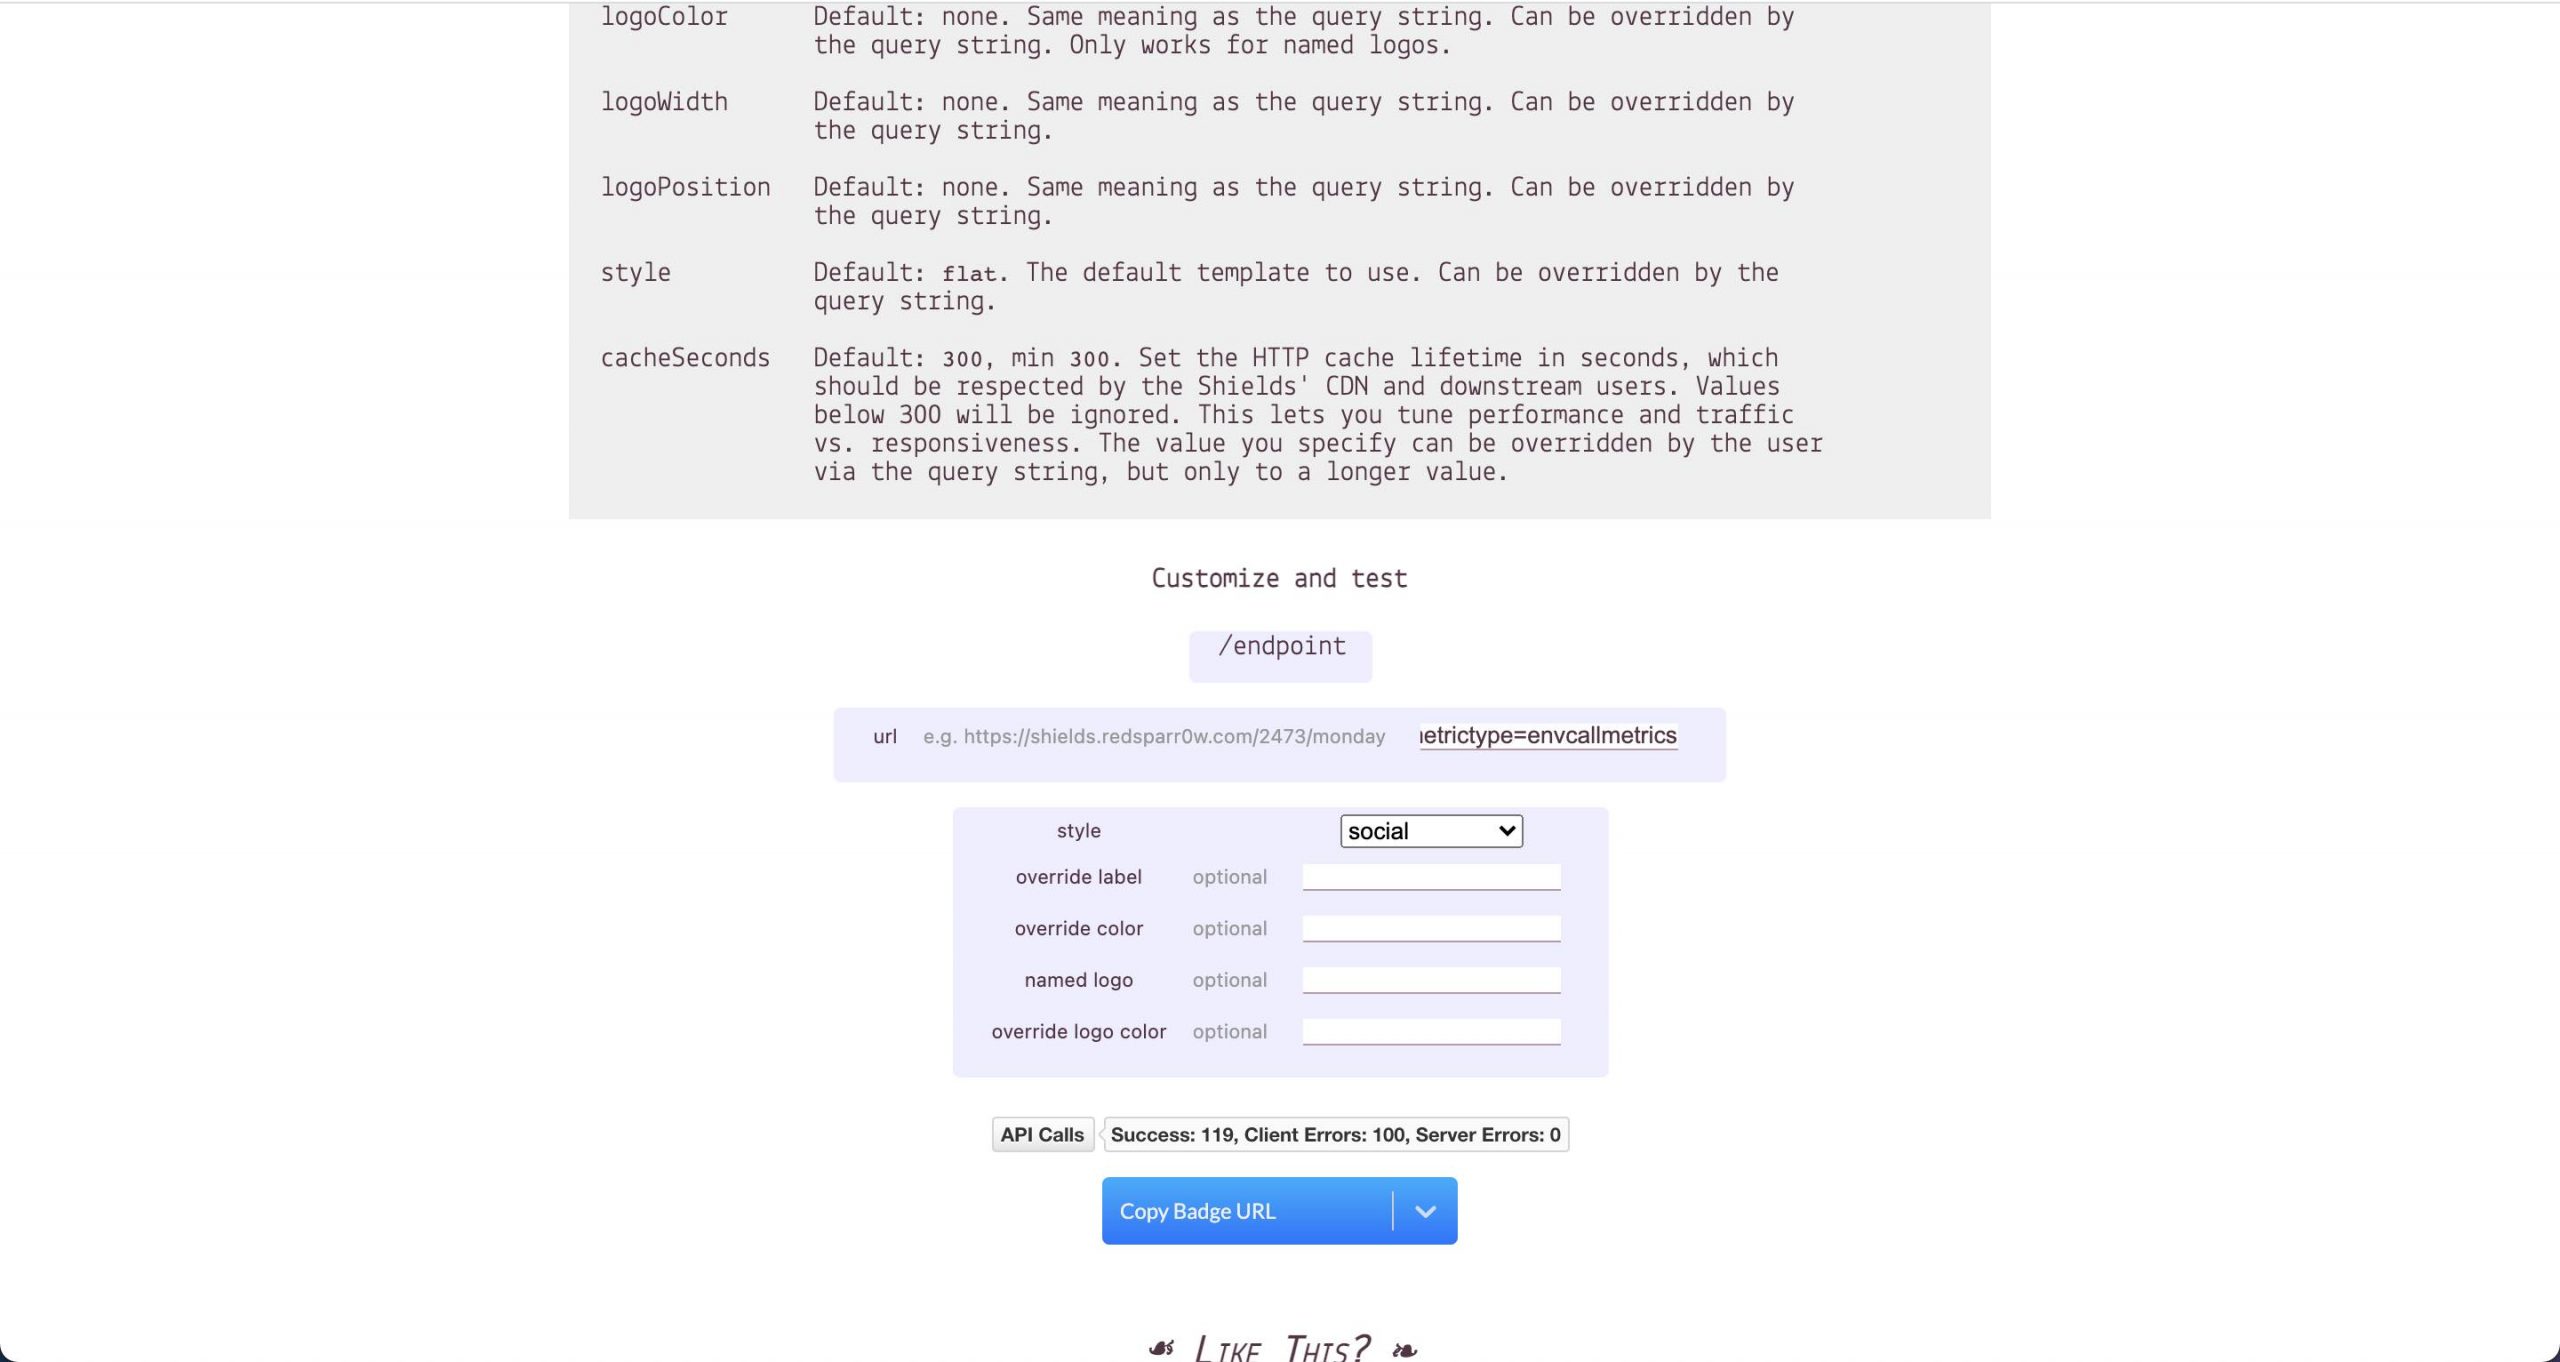
The shields URL for API statistics for environment aws is:
https://img.shields.io/endpoint?style=social&url=https%3A%2F%2Fc940...eb0.cloudapp-enterprise.appcelerator.com%2Fapi%2Fenvmetrics%3Feid%3D8a2e862d779860e20177a6888d450233%26metrictype%3Denvcallmetrics
The shields URL for Average Response Time for environment aws is:
https://img.shields.io/endpoint?url=https%3A%2F%2Fc940...eb0.cloudapp-enterprise.appcelerator.com%2Fapi%2Fenvmetrics%3Feid%3D8a2e862d779860e20177a6888d450233%26metrictype%3Denvavgresptime
Edit the Environment Description In the UI
Use the shields URL in a markdown image (e.g. ) as shown in the screenshots below by clicking on the Edit Environment button.
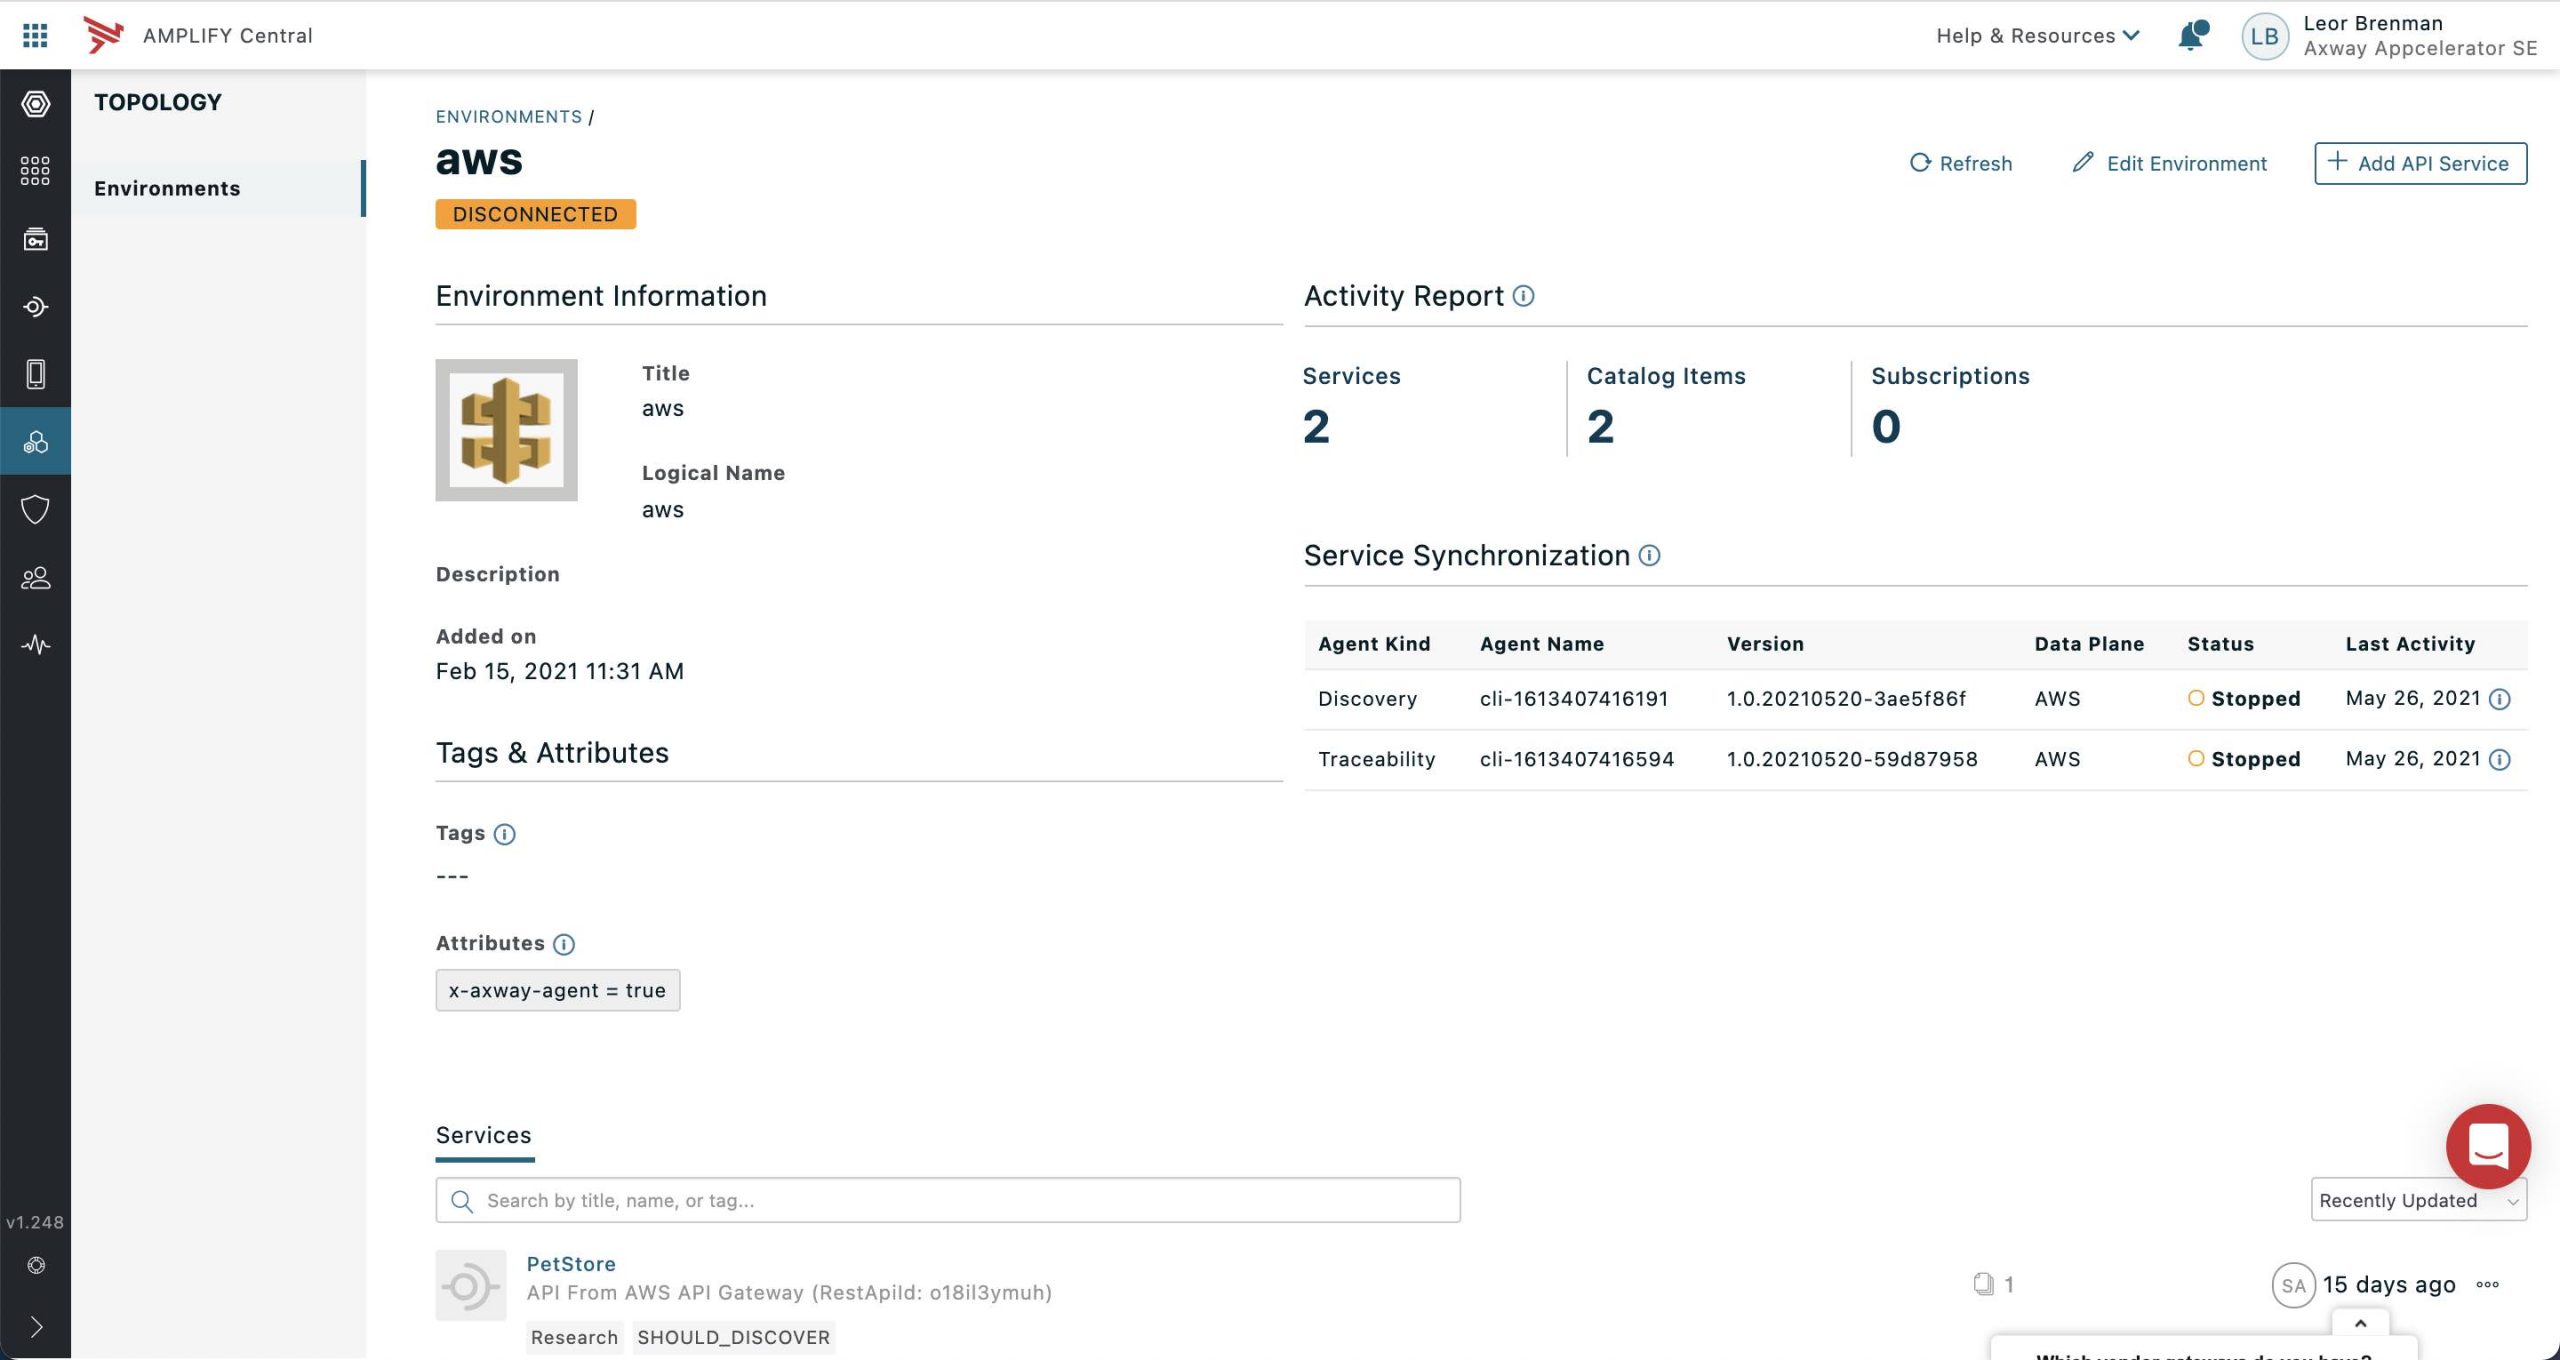
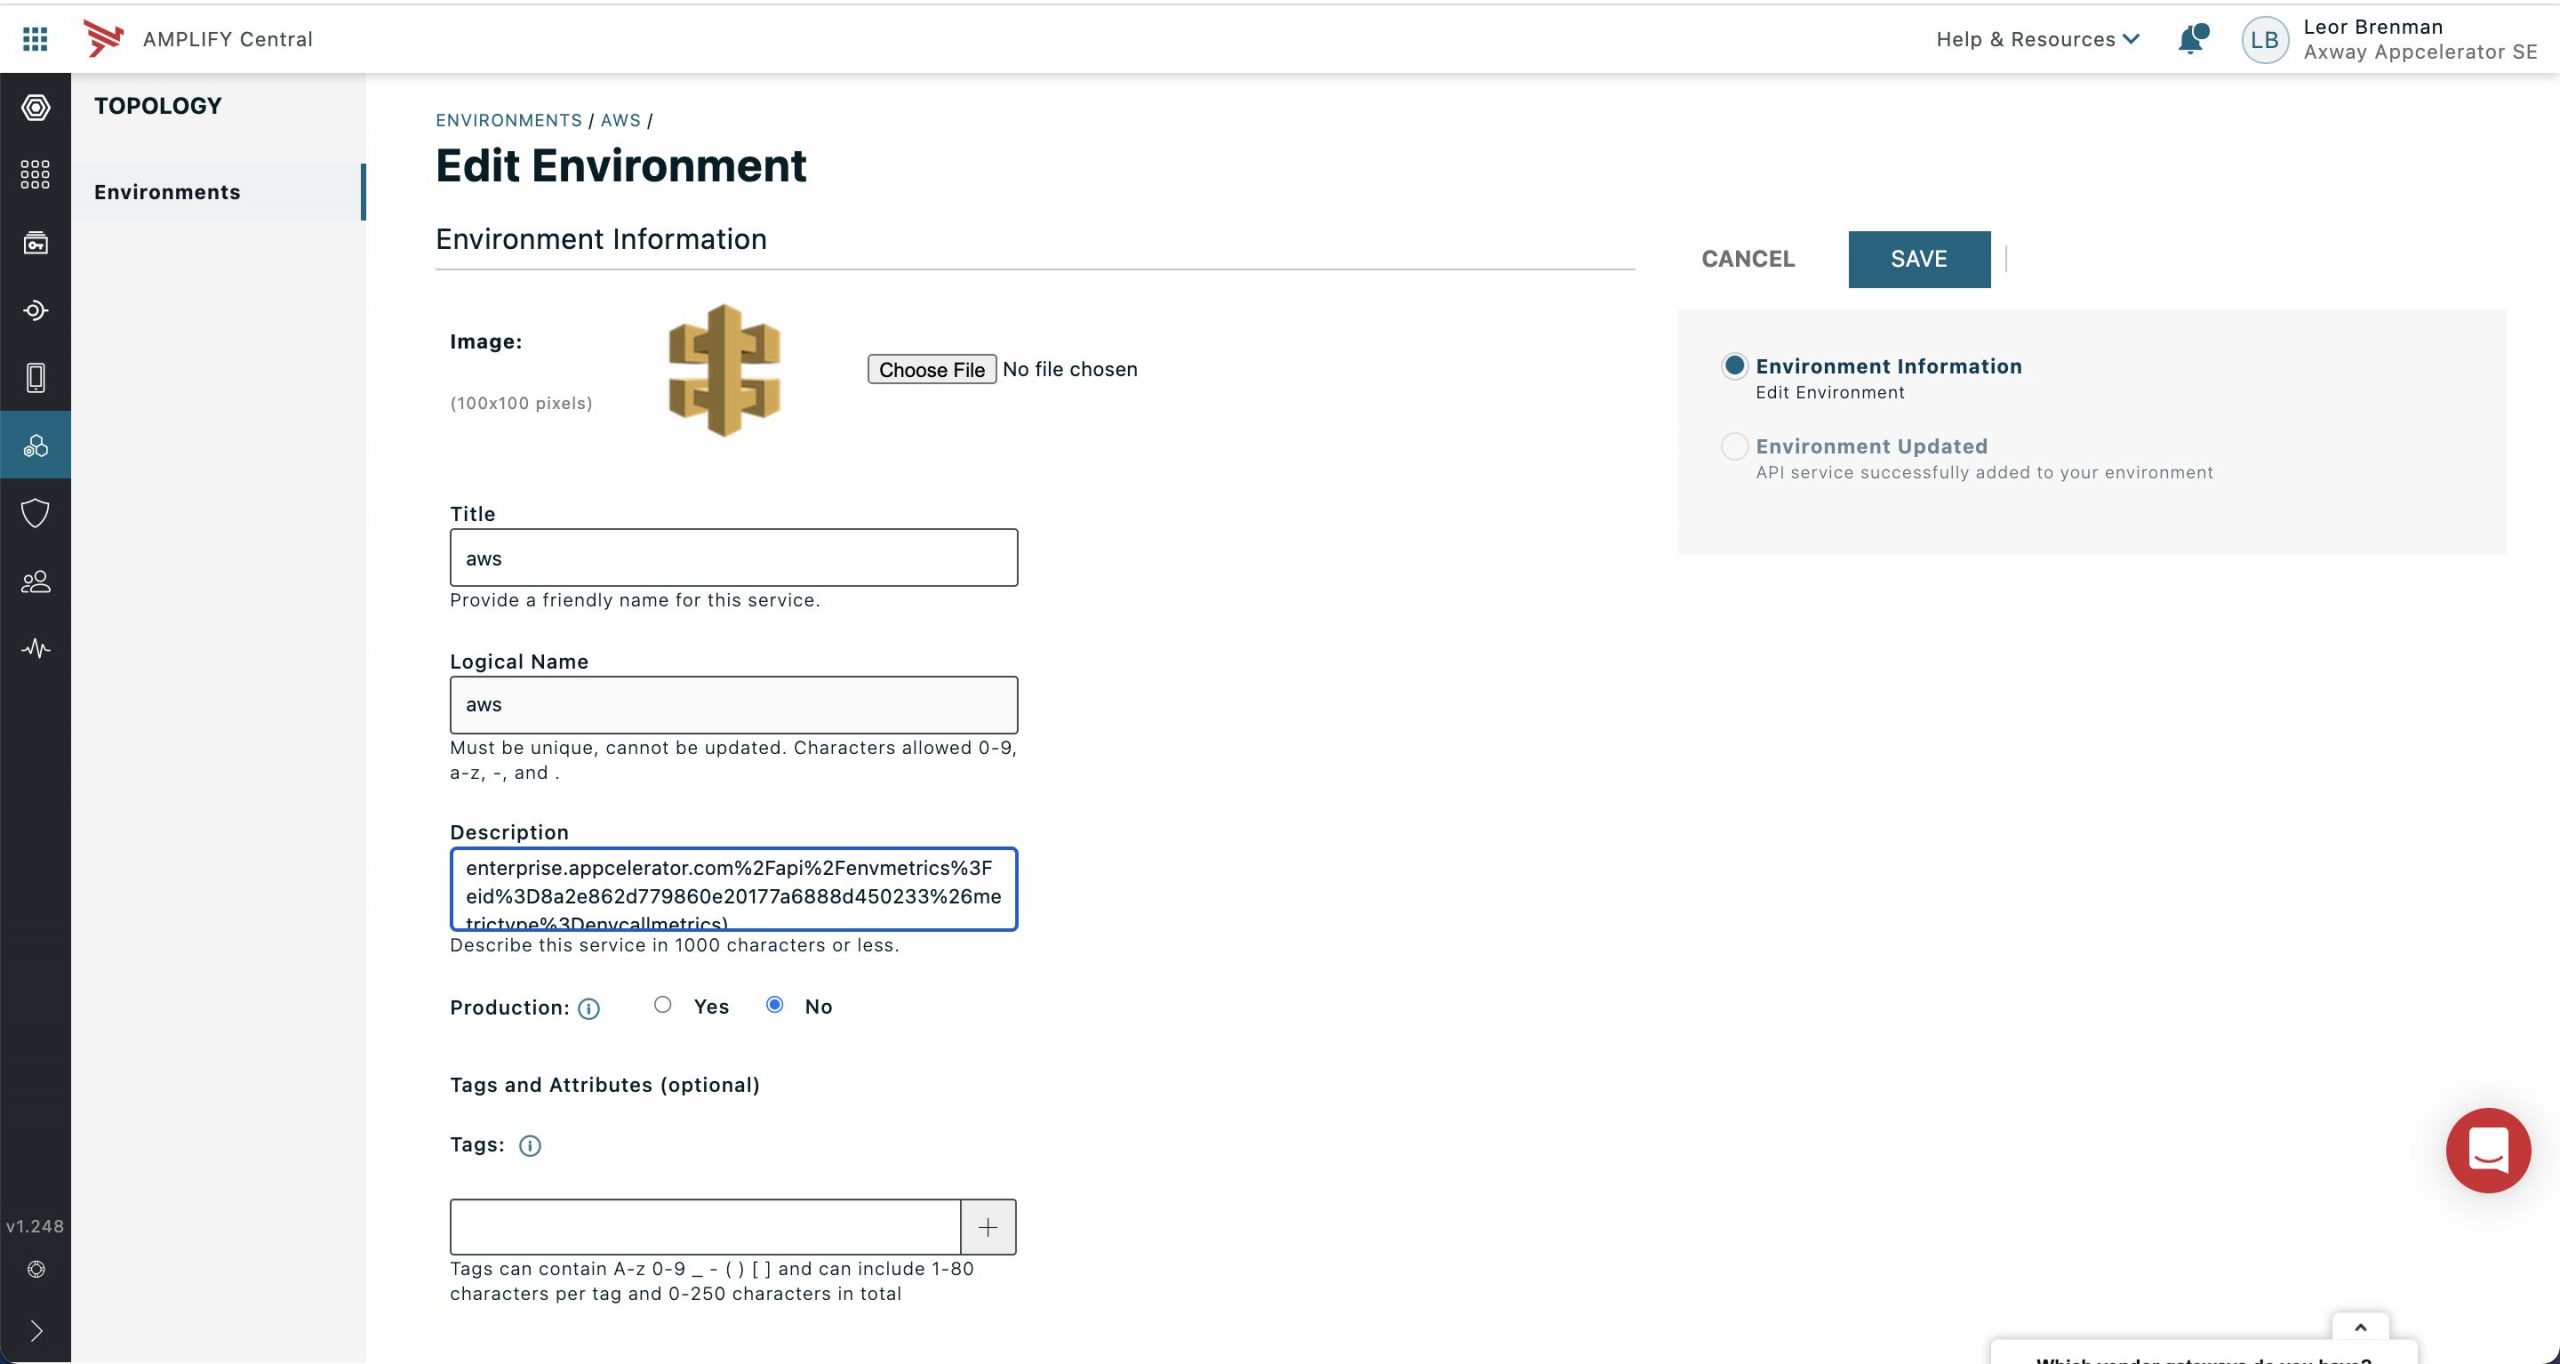
Here is what I entered in the environment description field:


AWS API Gateway
and here is the result:
Summary
In this blog post, we saw how the Amplify Central Traceability API can be used together with API Builder and shields.io to add API traffic badges to our Amplify Central environment. This makes for a better user experience for the API Governance team and reduces time and effort to see the API traffic data for each environment.
Learn more about Amplify Central Integration Webhooks – API Publish Approval.

