

 ChartIQ is an HTML5 charting library and technical analysis solution that works seamlessly across desktop, web, tablet and smartphone. More than just another charting tool, ChartIQ is a developer-friendly financial visualization engine built using a highly robust and proprietary API, and delivered as a simple SDK file. ChartIQ offers a wide range of innovative data visualizations for time series charting that intuitively puts social, fundamental and macro data in the context of charts across all asset classes.
I suggest you take a look at their demo.
For the laziest, here is a screenshot:
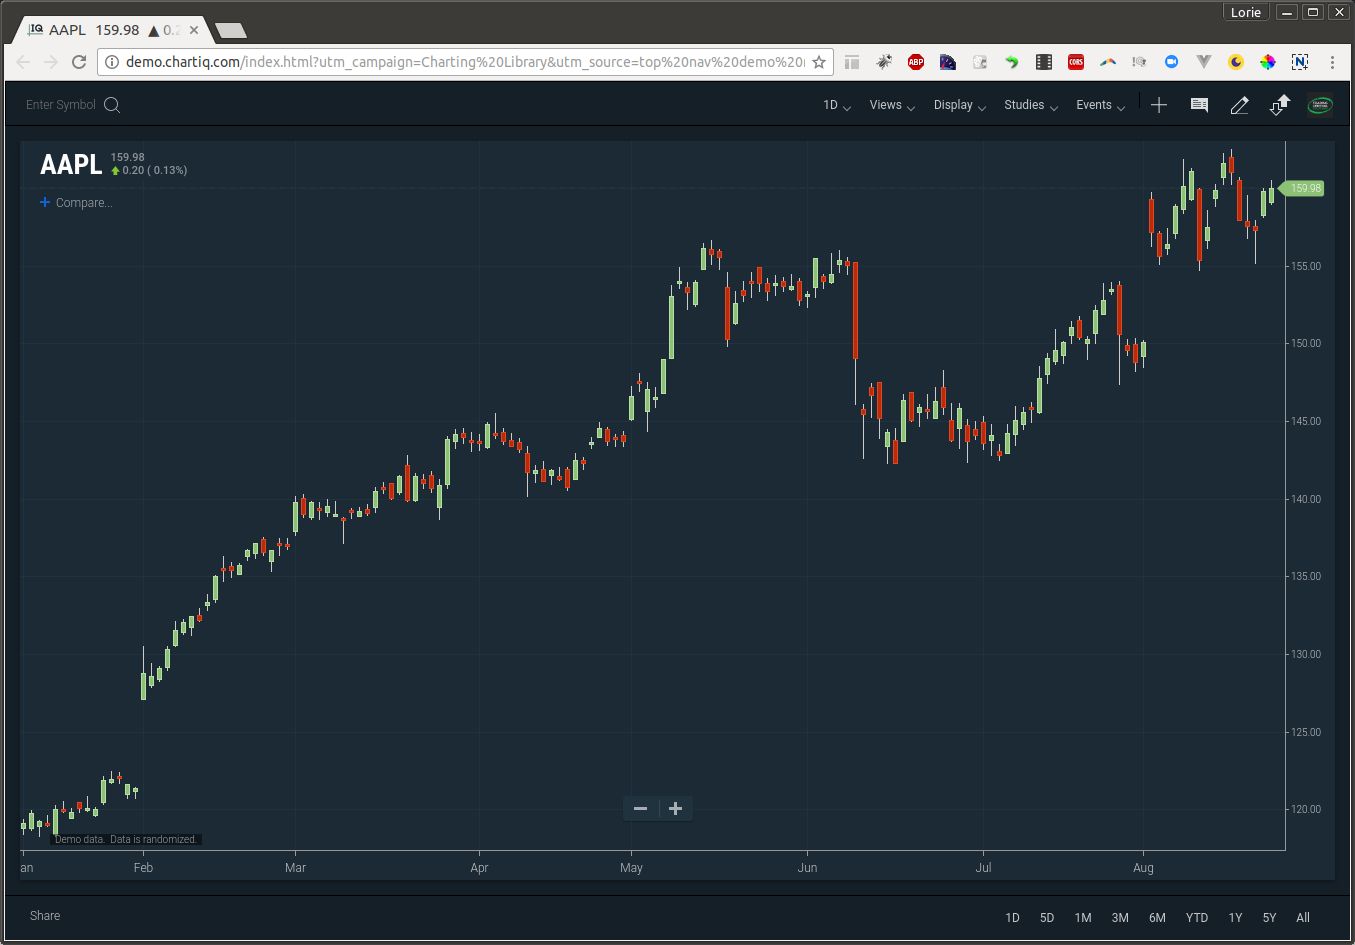
You can see that in terms of user experience, it’s far more attractive than your regular excel sheet 🙂
But what if we could add a real-time update feature to these beautiful charting?
You dreamed about it? Streamdata did it!

You can find our fork of the ChartIQ Angular sample here.
ChartIQ provides demos in some JavaScript frameworks like React or Angular. We decided to fork their Angular demo and see how we can integrate Streamdata.io.
To do so, we modified the existing Chart Service (in src/app/chart_service/chart.service.ts), and added a new generic feed using Streamdata (src/app/chart_service/streamdataio.feed.ts).
Let’s have a look at the Chart Service first.
The class starts with the definition of a ChartService as follows:
export class ChartService {

  constructor() {
  }

  attachQuoteFeed(chart): void {
    chart.attachQuoteFeed(new StockMarketFeed(chart));
  }
}
Nothing fancy so far. We are just creating an instance of StockMarket feed and attach it to the ChartService.
The StockMarketFeed class is extending the generic Streamdata.io Feed. We’ll see this one in details later, but first, let’s see how it’s used.
To use the abstract Streamdata.io Feed, you need to implement three abstract methods:
– fetchInitialData : get the initial array of data for the graph. This does not make much sense to gather historical data through Streamdata, as it is a real-time enabler. Instead, you’d better use a REST API to get data for the specified time range. This is where you can do it. In our sample implementation, we are using the API provided by ChartIQ to get demo quotes: https://simulator.chartiq.com/datafeed?session=<UUID>&identifier=<SYMBOL_TICKER> (checkout the quote feed simulator sample within the chartiq library for more informations)
– buildSymbolUrl : this is where you build the URL that will be streamed to get real time data associated with the requested symbol. In this case, we will use Streamdata.io API that emulates real-time data: This URL is simply concatenated with the symbol to get the data from one single symbol.
– formatLastQuote : format the data so that ChartIQ can plot new points. Our StockMarket API does not return OHLC formatted quotes, so we simply provide the last value and ChartIQ does the magic!
Here is the complete implementation of StockMarketFeed:
export class StockMarketFeed extends StreamDataIoFeed {

  constructor(chart) {
    super(chart, "http://stockmarket.streamdata.io/v2/prices", "<your token>");
  }

  public fetchInitialData(symbol, startDate, endDate, params, cb) {

    if (symbol || symbol === "") {
      symbol = symbol.toUpperCase();
    } else {
      cb({quotes: [], moreAvailable: false});  //short circuit ajax request
      return;
    }
    if (symbol.charAt(0) != "^" && CIQ.Market.Symbology.isForexSymbol(symbol)) symbol = "^" + symbol;
    let url = "https://demoquotes.chartiq.com/" + symbol.replace(/\//g, "-");
    let that = this;
    CIQ.postAjax(url, null, function (status, response) {
      if (status != 200) {
        cb({error: status});
        return;
      }
      let quotes = that._extractQuotes(response);
      let newQuotes = [];
      for (let i = 0; i < quotes.length; i++) {
        newQuotes[i] = {};
        newQuotes[i].Date = quotes[i][0]; // Or set newQuotes[i].DT if you have a JS Date
        newQuotes[i].Open = quotes[i][1];
        newQuotes[i].High = quotes[i][2];
        newQuotes[i].Low = quotes[i][3];
        newQuotes[i].Close = quotes[i][4];
        newQuotes[i].Volume = quotes[i][5];
        newQuotes[i].Adj_Close = quotes[i][6];
      }
      params.noUpdate = true;   //Daily demo quotes do not support updates
      cb({quotes: newQuotes, moreAvailable: false, attribution: {source: "demoquotes", exchange: "RANDOM"}}); // set moreAvailable to true so that the chart will request more when scrolling into the past. Set to false if at the end of data.
    });
  }

  private _extractQuotes(response) {
    let varName = response.substr(0, response.indexOf("="));
    let valueToParse = response.substring(response.indexOf(varName + "=") + (varName + "=").length, response.length - 1);
    try {
      return JSON.parse(valueToParse.replace(/,0+/g, ",0").replace(/,[.]/g, ",0.").replace(/;/g, ""));
    } catch (e) {
      return [];
    }
  }

  protected buildSymbolUrl(serviceUrl: string, symbol: string) {
    return `${serviceUrl}/${symbol}`;
  }

  protected  formatLastQuote(symbol, quote): any {
    return {
      Last: quote.last,
      Volume: quote.volume,
      DT: new Date(quote.dt)
    };
  }

}
As you can see, including a Streamdata.io feed in a Chart is quite easy! You will need a Streamdata.io token to initialize your feed. If you don’t have one yet, you can get one by creating a free account at https://portal.streamdata.io/#/register
Though you could use it as is without knowing more, you may be curious to know how this StreamdataIoFeed is built. Here is a detailed explaination.
StreamdataIoFeed uses two libraries:
– streamdataio-js-sdk: the Streamdata.io JavaScript SDK. Sources are available here:
– fast-json-patch: library used to handle JSON patch
. It has been implemented by eFeed implementation tutorial provided by ChartIQ. We had to define three main methods:
– fetchInitialData: this method will be called by ChartIQ when initializing the graph. We’ll leave this method abstract, in order to be implemented by subclasses. As already mentioned, Streamdata is not relevant for fetching historical data. This has to be done through calling a static API.
– subscribe: this method will be called by ChartIQ when the user changes a symbol or adds a comparison symbol
– unsubscribe: this method will be called by ChartIQ each time the chart no longer require a symbol
On subscribe, we’ll start a streaming session for the specified symbol. We’ll use the buildSymbolUrl abstract method to get the URL for the symbol, start the streaming session using Streamdata.io SDK, and define how to behave when receiving data. Implementation is as follows:
public subscribe(params) {
  if (params.symbol || params.symbol === "") {
    // Retrieve symbol and comparaison information
    let symbol = params.symbol.toUpperCase();
    let secondary = this.subscriptions && this.subscriptions.length > 0;

    // Build the specific url to call from service url and symbol
    let symbolUrl = this.buildSymbolUrl(this._serviceUrl, symbol);

    // Create event source
    let myEventSource = StreamDataIo.createEventSource(symbolUrl, this._token);
    let lastQuote = null;
    myEventSource.onData((data) => {
        lastQuote = data;
        this._appendLast(lastQuote, symbol, secondary);
      }, this)
      .onPatch((patch) => {
        applyPatch(lastQuote, patch);
        this._appendLast(lastQuote, symbol, secondary);
      }, this)
      .onError((error) => {
        console.error('%o', error);
      });
    this._streams.set(symbol, myEventSource);
    myEventSource.open();
  }
}
We are opening a new event source for each symbol added to the graph. A little warning here: as Streamdata.io is not HTTP/2 compliant yet, users will not be able to add more than three symbols for comparison, as browsers only supports four opened connections.
The secondary variable lets us know if the symbol is the main graph symbol or if it is a new symbol added for comparison.
Now let’s see how we add new data to the graph with _appendLast method:
private _appendLast(lastQuote, symbol, secondary) {
  let formatedQuote = this.formatLastQuote(symbol, lastQuote);
  if (secondary) {
    this._chartEngine.appendMasterData(formatedQuote, null,
      {fillGaps: true, secondarySeries: symbol});
  } else {
    this._chartEngine.appendMasterData(formatedQuote, null, {fillGaps: true});
  }
}
The data are appended to the master data in an appropriate way depending on whether it’s the main symbol or a comparison symbol. For more information about this data injection, you can refer to http://documentation.chartiq.com/CIQ.ChartEngine.html#appendMasterData
Finally, let’s see what is done in the unsubscribe meth
od:
public unsubscribe(params) {
if (params.symbol || params.symbol === "") {
let symbol = params.symbol;
if (this._streams.has(symbol)) {
this._streams.get(symbol).close();
this._streams.delete(symbol);
}
}
}The streaming session for the specified symbol is closed.
This is it! You now know everything about the generic StreamdataIoFeed. You’re free to use it with the API of your choice by modifying the ChartService.
When running this sample, you will be able to see something like this (we accelerated it 40 times for your viewing comfort)
Hope you enjoyed this tutorial.
For any remark or question, feel free to reach out to us at support@streamdata.io