

Microservices architecture is a software development architectural style, whereby a complex business problem is solved by a suite of small services. These microservices are loosely coupled and can be developed, deployed, and maintained independently.
Each of these services is responsible for a discrete task and can communicate with other services through simple APIs. A single microservice is conceptually simple, but a system of interoperating microservices quickly becomes complex.
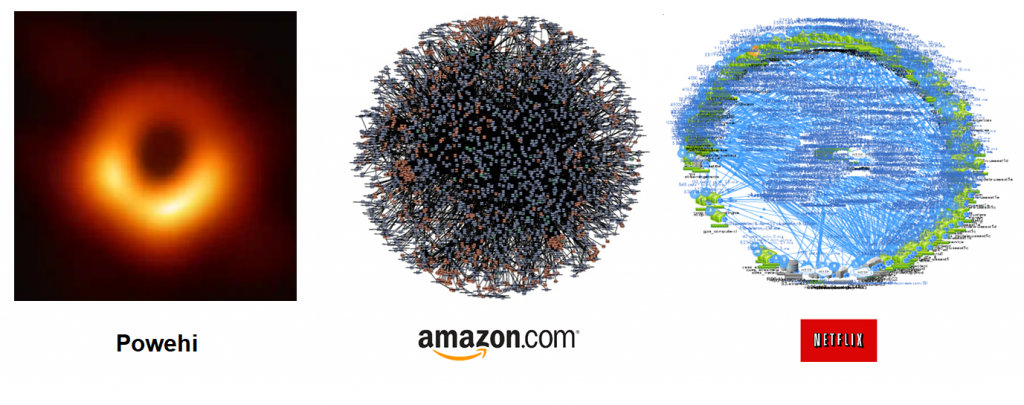
You don’t have to be a unicorn, like Amazon or Netflix, in order for your microservices architecture to turn into the death star or a murder mystery for every outage. If you apply Metcalfe’s law to the services which you have deployed, you will quickly see that there is an explosion in the potential interconnections. Metcalfe’s Law is related to the fact that the number of unique possible connections in a network of n nodes can be expressed mathematically as the n(n-1)/2:
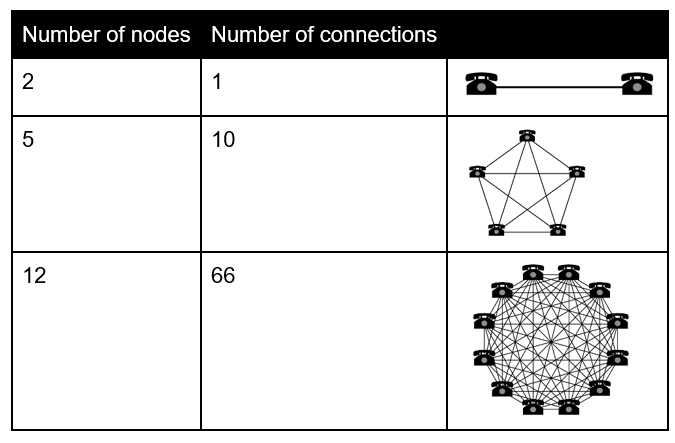
As the chart above depicts, as the number of nodes increases, the explosion of interconnections occurs quickly and any service could fail or behave unexpectedly. You must operate with the mantra that all systems eventually fail.
A single microservice may fail, leading one to the false conclusion that this microservice is the culprit for an outage; but in fact, it is likely due to one of its dependencies which could be another microservice(s), file system, database, cloud service, etc. Every interaction between a service and its dependencies is a potential cause for failure, compounding the points of failure in the architecture even further beyond the graph of microservice nodes.
OpenTelemetry
Given all the potential failure locations how do you separate the signal amid the noise so that you can do preventive/proactive maintenance of the system? Enter OpenTelemetry.
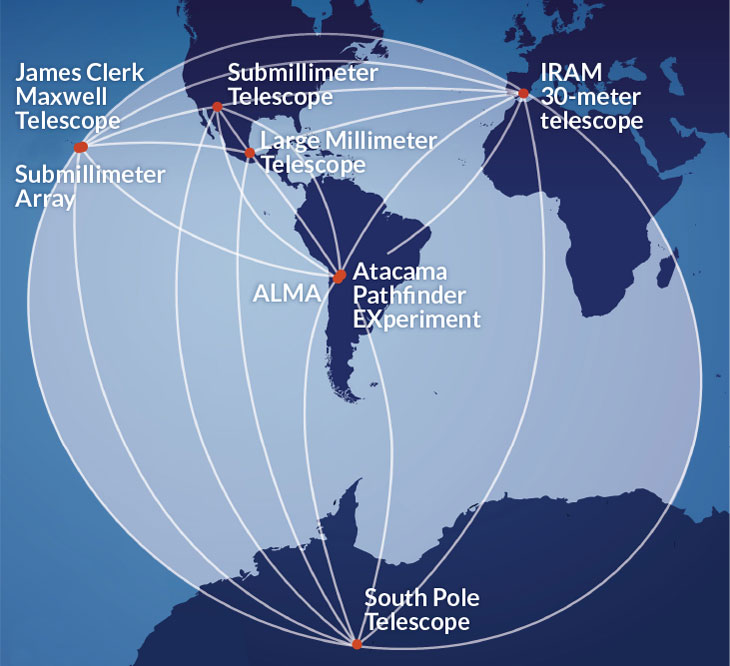
If you recall the recent scientific breakthrough of the first photograph of a black hole – this discovery has many things in common with monitoring microservice architecture. The project of imaging the black hole required seven observatories across the globe working in tandem as one virtual Earth-sized radio dish (Event Horizon Telescope). So in order to get a view of the black hole, data from each observatory was braided together to form the complete picture.
Distributed tracing
Distributed tracing is a method used to profile and monitor applications, especially those built using a microservices architecture. Distributed tracing helps pinpoint where failures occur and what causes poor performance. The OpenTelemetry project (merger of OpenTracing and OpenCensus under CNCF sandbox) is made up of an integrated set of APIs and libraries and a collection mechanism (via an agent and collector). These components are used to generate, collect, and describe telemetry about distributed systems.
OpenTelemetry project provides a standard, portable API for distributed tracing instrumentation.
The basic idea behind distributed tracing is relatively straightforward — specific points of interest must be identified within a system and instrumented and each node’s request and response within your distributed system should be collected as a trace.
All of the trace data must be coordinated and collated to provide a meaningful view of a request. Distributed Tracing provides visibility into the pathway that a request takes through your distributed system.
The origins and inspirations for Distributed Tracing come from Google’s Dapper paper which describes Google’s solution for distributed tracing. The Dapper paper led to the creation of the Zipkin, Jaeger and OpenTracing projects. Some terminology related to distributed tracing:
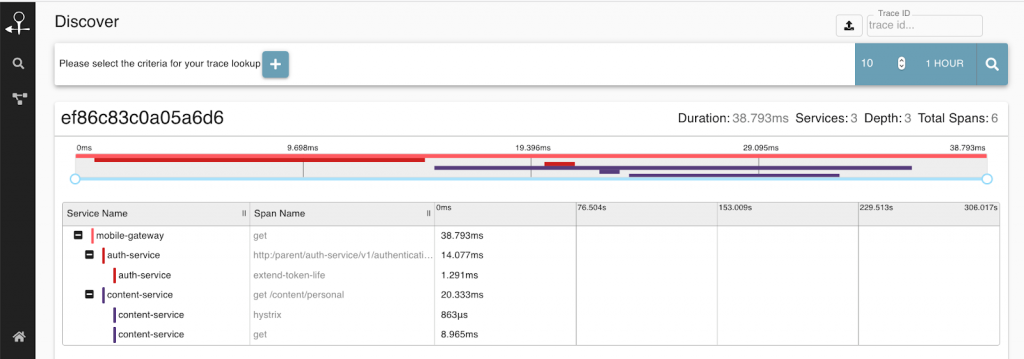
Span — It represents a logical unit of work that has an operation name, the start time of the operation, and the duration.
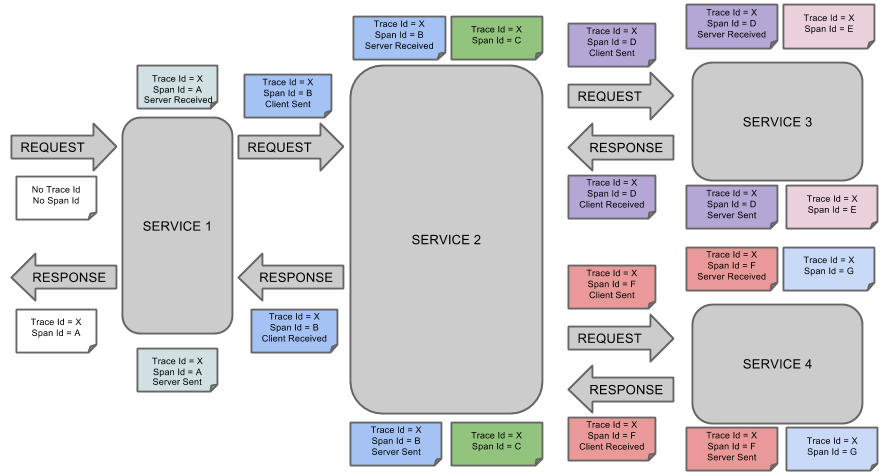
Trace — A Trace tells the story of a transaction or workflow as it propagates through a distributed system. It is simply a set of spans sharing a TraceID, Trace Id = X in the diagram below. Each component in a distributed system contributes its own span. The trace captures the work done by each service as a collection of Spans all sharing the same Trace ID.
There are 7 spans below (span id A to G). More granular operations of a service can be captured as Children Spans which have a child reference pointing to their parent Span. Hence the tuple (TraceID, SpanID, ParentID) sufficiently describes a Span’s position in a Trace so this is called the SpanContext.
Using the OpenTracing libraries to instrument your code allows you to see a transaction and associated spans as a request is processed by your distributed microservices
Volume of data
Large distributed systems can potentially generate gigabytes of new metadata about their behavior in a short time. Just think of the typical layers in microservice deployment – host machine, cluster management (Kubernetes), docker instance and the application itself, add in network dependency and dependencies on external systems (database, file system, etc.).
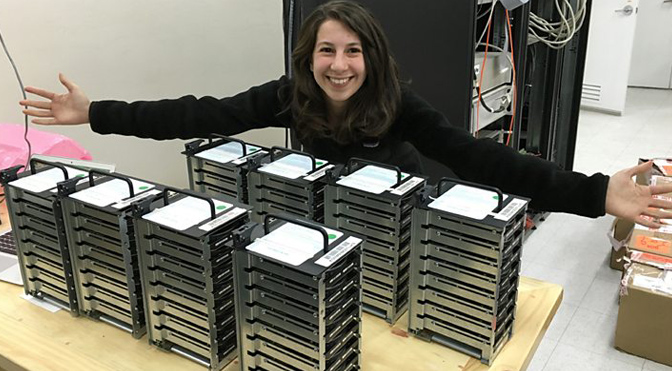
The volume levels of output from these services need to be carefully managed. It took half a ton of hard drives to store the Black Hole image which adds up to five petabytes. There was so much data it was quicker to ship them by snail mail rather than send the data over the internet
What’s in a name?
By the way, the black hole has now been christened “Powehi.” This is a Hawaiian phrase referring to an “embellished dark source of unending creation.” I wonder would anyone use this phrase refer to a microservice architecture? Maybe it captures the DevOps mindset. Ops would say that a microservice architecture without distributed tracing is “embellished dark source” as they’ve to cope with the death star. Whereas a developer would likely be running towards the bright new shiny technology happily saying that a microservice architecture is a “source of unending creation!”
More from David McKenna: READ THE MICROGATEWAY BLOG SERIES.