

The default behavior of flow execution logic in the Integration Builder is to log only the trigger unless encountering an error condition during the flow. While this behavior does optimize logging and is ideal under normal conditions, it limits the visibility you have during development time. If you want to be able to see what your flow is doing and have visibility into request and response objects then you need another solution.
Quite often, the easiest approach is to use Debugging mode in the flow editor, but that mode is limited to scenarios where you want to replay an existing trigger and aren’t running a flow where multiple executions with the same data would result in duplicate entries in a downstream service. Sometimes you just need to be able to debug live executions.
How to trigger step execution logging
To accomplish this, we will take advantage of the execution logger’s default behavior. It only creates a full execution log when an error condition occurs, so let’s intentionally throw an error. The flow will still execute successfully but, as its last step, throw an error forcing the full execution trace. For anyone who has ever used console or trace file logging in their code for debugging purposes, this should be a familiar concept.
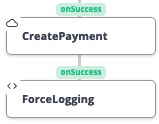
Add a JS Script step in the On Success path of the last step in your flow. In this example, the CreatePayment Connector Instance step is the final step in the business logic of my flow. I’ve added a JS Script step which will execute after CreatePayment and named it ForceLogging.
The content of the step is a single line of code.
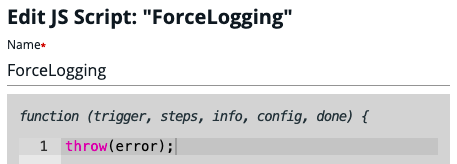
When your flow hits this step, it will throw an empty error, but that is enough to accomplish the goal of triggering the trace logger.
You are now ready to debug your flow using live flow executions. Just remember to remove this step before you put your flow into production.
How to enable step execution logging
If you’re developing integrations and need more methods to troubleshoot during this phase, this article helps you develop flows by enabling step logging. By default, Integration Builder only shows the trigger step to facilitate flow execution performance. However, when steps are not visibly logged, it is tougher to develop flows. If you use the debug view in Flows to replay a trigger, it shows you the execution steps. For example, this blog post will help you as you complete a simple integration builder flow.

How do I develop a flow when I can’t see the step execution?
- Create a flow
- Get the flow ID
- Go to the API Docs for the platform via Quick Start (top left corner) > View our API Docs > Flows.
Once in API Docs,
- Find GET /formulas/{id} method and click Try it out.
- Open another browser tab to get the flow ID from the specific flow you want to troubleshoot.
- Enter the flow ID into the required field for the GET /formulas/{id} method and click Execute.
- Then, copy the response body.

Still in the API Docs, go to the PUT /formulas/{id} method.
- Complete the ID field with the same flow ID as above.
- Paste the copied response body from the previous API call in the formula model for this new API call.
- In the Formula template, go to the pasted response body, edit debugLoggingEnabled to true and click Execute.
Sample response for step 3:
This file contains hidden or bidirectional Unicode text that may be interpreted or compiled differently than what appears below. To review, open the file in an editor that reveals hidden Unicode characters.
Learn more about bidirectional Unicode characters
| { | |
| "id": 30020, | |
| "name": "Syncp Event Test", | |
| "userId": 21107, | |
| "accountId": 18281, | |
| "createdDate": "2019-09-20T21:08:41Z", | |
| "steps": [ | |
| { | |
| "id": 224603, | |
| "onSuccess": [ | |
| "consoleLog2" | |
| ], | |
| "onFailure": [], | |
| "name": "consoleLog", | |
| "type": "filter", | |
| "properties": { | |
| "body": "console.log(trigger);" | |
| } | |
| }, | |
| { | |
| "id": 224606, | |
| "onSuccess": [ | |
| "consoleLog2" | |
| ], | |
| "onFailure": [], | |
| "name": "consoleLog1", | |
| "type": "script", | |
| "properties": { | |
| "body": "console.log(trigger);" | |
| } | |
| }, | |
| { | |
| "id": 224604, | |
| "onSuccess": [], | |
| "onFailure": [], | |
| "name": "consoleLog2", | |
| "type": "script", | |
| "properties": { | |
| "body": "console.log('Done!');" | |
| } | |
| } | |
| ], | |
| "triggers": [ | |
| { | |
| "id": 26550, | |
| "onSuccess": [ | |
| "consoleLog1" | |
| ], | |
| "onFailure": [], | |
| "type": "event", | |
| "async": true, | |
| "name": "trigger", | |
| "properties": { | |
| "elementInstanceId": "${config.sync}" | |
| } | |
| } | |
| ], | |
| "engine": "v3", | |
| "active": true, | |
| "debugLoggingEnabled": false, | |
| "singleThreaded": false, | |
| "configuration": [ | |
| { | |
| "id": 54686, | |
| "key": "sync", | |
| "name": "sync", | |
| "type": "elementInstance", | |
| "required": true | |
| } | |
| ] | |
| } |
Result
Now you should see the flow steps in the execution screen such as in this example.

Make sure you turn off this feature when you complete development and start deploying integrations to production.
Happy Integrating!
Read more about Integration Builder Flow as a Resource (FaaR): Part 1.