

In the previous post, we were presenting the traditional “Hello World” example using Riot.js a UI micro-library that enables to create custom tags “à la React” (if you would like something to compare it to). Not only does Riot.js support custom tags but also has nice features such as eventing and routing (see this post). Riot.js team point of view is: custom tags + events + router = backbone to build cool nice applications. So, let’s explore a bit more Riot.js features…
To continue our exploration of Riot.js features, we will rely on our “good old” Stockmarket API. I say “good old” because the Stockmarket API is a small application we have created to illustrate how to use our streamdata.io technology. For those who have visited our site, they know that this API has the honor place in our “Try it out!” section. For those who haven’t visited our site yet (shame on them!), the Stockmarket API is a JSON Rest API who has only purpose: sending a JSON array of stocks of a stock-market. Actually, not real ones, just dummy ones. To get an idea, here is a result of a curl on this API:
curl http://stockmarket.streamdata.io/prices
[{"title":"Value 0","price":30,"param1":"value1","param2":"value2","param3":"value3","param4":"value4","param5":"value5","param6":"value6","param7":"value7","param8":"value8"},
{"title":"Value 1","price":99,"param1":"value1","param2":"value2","param3":"value3","param4":"value4","param5":"value5","param6":"value6","param7":"value7","param8":"value8"},
...
{"title":"Value 14","price":95,"param1":"value1","param2":"value2","param3":"value3","param4":"value4","param5":"value5","param6":"value6","param7":"value7","param8":"value8"}]
Impressive, isn’t it? What will interest us is actually two fields of a stock: the title (which have an original name “Value xxx” where xxx is from 0 to 14) and the price. The second thing that is worth noting is that every time you call the Stockmarket API, some of the prices of the “Value xxx” change.

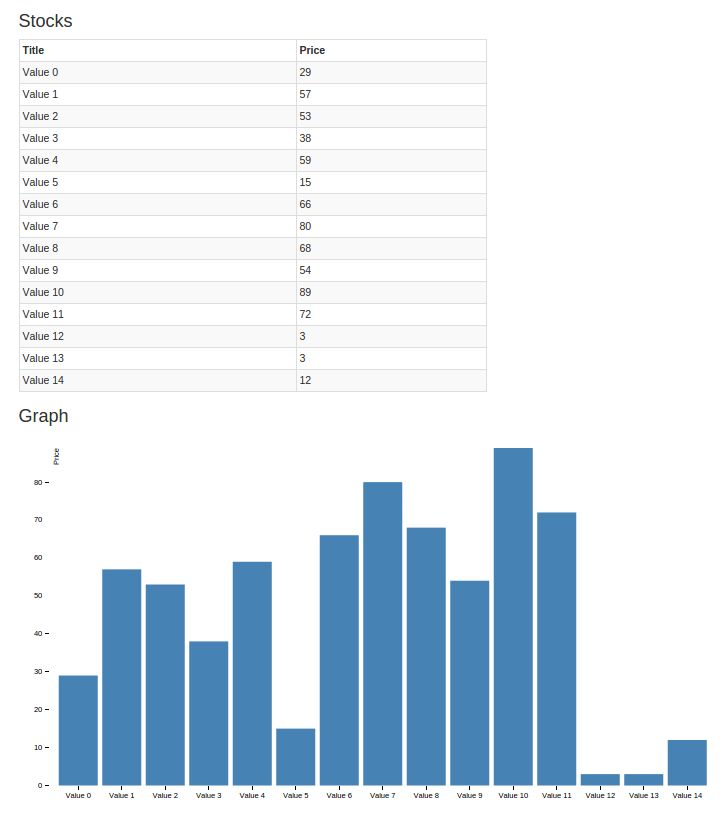
Let’s start coding a small app based on that. The first goal of our example is to show how it is quite simple to display the same data under different forms thanks to Riot.js custom tags. In this first step, our app will display the list of stocks (title and price) as a table and as a chart. To get an idea, here is a screenshot of this amazing app:
In the next step, we will use another feature of Riot.js: the observable. Observables are the technical components that deals with the events feature of Riot.js: they enables to send and receive events.
As far as the last step… well, it’s a surprise!
Let’s start with step #1.
Step #1 – an amazing app
As for our previous posts about Riot.js, we manage our dependencies and the build phases with npm. If you don’t have npm yet, I advice you to install it with nvm, a really nice tool that can manage several npm versions.
Here is our project hierarchy:
your-app/
├── app/
│    ├── index.html
│    ├── css/
│    │    ├── main.css
│    │    └── stockmarket-barchart.css
│    └── js/
│         ├── stockmarket-barchart.tag
│         └── stockmarket-table.tag
├── dist/
└── package.json
Compared to the “Hello World” sample, I’ve slightly changed the structure of the project. I am still experimenting what structure would fit best… In addition to Riot.js, we use Bootstrap for theming and D3.js for the chart library. The package.json looks like this:
{
  "name": "stockmarket",
  "version": "1.0.0",
  "description": "riot.js stockmarket sample with npm and es6",
  "scripts": {
    "compile": "riot --type es6 app dist",
    "watch": "riot -w --type es6 app dist",
    "browsersync": "browser-sync start --server --files 'dist/*.js, app/*.html' --startPath app",
    "serve": "parallelshell 'npm run watch' 'npm run browsersync'"
  },

 "dependencies": {
    "babel-core": "^6.18.2",
    "babel-preset-es2015-riot": "^1.1.0",
    "bootstrap": "^3.3.7",
    "d3": "^4.4.0",
    "riot": "^3.0.1"
  },
  "devDependencies": {
    "babel-plugin-external-helpers-2": "^6.3.13",
    "browser-sync": "^2.18.2",
    "parallelshell": "^2.0.0"
  }
Now, let’s start with coding the table!
stockmarket-table
To display a table of stocks, we create a Riot.js component that will be loaded in our index.html. The stocks will be loaded in the index.html via an old classical XMLHttpRequest and be passed to the different Riot.js components (table and chart) when mounting the components. The stockmarket-table.tag looks like this:
<stockmarket-table>
  <h3>{opts.title}</h3>
  <table class="table table-striped table-bordered table-hover table-condensed" style="width: 70%;">
    <thead>
      <tr>
        <th>Title</th>
        <th>Price</th>
      </tr>
    </thead>
    <tbody>
      <tr each={opts.stocks}>
        <td>{title}</td>
        <td>{price}</td>
      </tr>
    </tbody>
  </table>
</stockmarket-table>
As you see, the stocks are accessible via the Riot.js opts object (which is the second argument of the riot.mount(.) instruction for remembrance). You also see that we use a new directive of Riot.js: each which enables to iterates through a collection. Pretty same syntax as the AngularJS one.
In the body of our index.html, we then declare:
<!doctype html>
<html lang="en">
<head>
  <meta charset="utf-8">
  <title>Stockmarket sample</title>

  <link rel="stylesheet" type="text/css" href="../node_modules/bootstrap/dist/css/bootstrap.min.css" />

  <link rel="stylesheet" type="text/css" href="css/main.css" />
</head>
  <body>
    <!-- mount point -->
    <stockmarket-table></stockmarket-table>

    <!-- include riot.js -->
    <script src="../node_modules/riot/riot.min.js"></script>

    <script src="../node_modules/d3/build/d3.min.js"></script>

    <script src="../dist/js/stockmarket-table.js"></script>

    <script>
      ... Do some stuff to load the stocks from the Stockmarket API ...
      <!-- The second argument of the riot.mount() is the opts object used
              within the Riot.js tag component -->
      riot.mount('stockmarket-table', { title: 'Stocks', stocks: stocks });
    </script>
  </body>
</html>
That’s it for the stockmarket-table component…
“Oh wait!” will you tell me: “you are using directly Bootstrap style within the stockmarket-table.tag! Doesn’t it introduce a coupling between your component and this css library?”
And, with a little bit redish face of shame, I will answer: “Hum, yes… You’re right!” (You: “Boooh, you’ve been caught red-handed!”). Ok, if it wasn’t a sample and to respect the webcomponent philosophy, I would have:
- created a dedicated stylesheet for the stockmarket-table
- defined dedicated css classes (and probably dive into the joy of BEM or some other styling conventions…)
- used these classes in the html of the Riot.js component
Thus, our webcomponent stockmarket-table would be:
webcomponent "stockmarket-table" = stockmarket-table.tag + stockmarket-table.cssFor the stockmarket-table.css, I would probably have used SASS (or other clever CSS compiler) to inherit from the Bootstrap theme and to propose to the user of the webcomponent this default theme. Not happy, with that theme? Prefer a more “design-materialish” theme? Just change the stockmarket-table.css with your own and implement the css classes defined in it with your own code. That’s the modularity of the thing, I think and I would favor this practice: decomposing the webcomponent into a tag and a css so that the consumer of the tag can override the css at will.
Ok. I would have done that (but did I tell you I need a bit sleep too?).
Now, let’s jump into the chart code…
stockmarket-barchart
For the Riot.js component stockmarket-barchart, I’ve used D3.js, a wonderful chart library… but whose learning-curve is sometimes a bit sloping. If you want to understand how to build a chart step by step, you can have a look at those great blogposts by Mike Bostock:
For this post, I took example on the Stacked Bar Chart demo which is in the last version of D3.js, v4.1.1. So, our Riot.js component looks like:
<stockmarket-barchart>
  <h3>{opts.title}</h3>
  <svg class="chart" id="{chartId}"></svg>

  <script type='es6'>
    this.chartId = opts.chart_id || 'chart-1';

    this.on('mount', function() {
      var data = opts.stocks.map(s => {
        return { 'title': s.title, 'price': s.price };
      });

      createChart(data, this.chartId, opts.height, opts.width);
    });


    function createChart(data, chartId, aHeight = 500, aWidth = 960) {
     var margin = {top: 20, right: 30, bottom: 30, left: 40},
                    width = aWidth - margin.left - margin.right,
                    height = aHeight - margin.top - margin.bottom;

     var x = d3.scaleBand()
                .rangeRound([0, width])
                .padding(0.1)
                .align(0.1);

     var y = d3.scaleLinear()
               .rangeRound([height, 0]);

     var chart = d3.select("#" + chartId)
                    .attr("width", width + margin.left + margin.right)
                    .attr("height", height + margin.top + margin.bottom)
                    .append("g")
                    .attr("transform", "translate("+ margin.left + "," + margin.top +")");

     x.domain(data.map(function (d) {
        return d.title;
     }));

     y.domain([0, d3.max(data, function (d) {
        return d.price;
     })]);

     chart.append("g")
            .attr("class", "axis axis--x")
            .attr("transform", "translate(0," + height + ")")
            .call(d3.axisBottom(x));

     chart.append("g")
            .attr("class", "axis axis--y")
            .call(d3.axisLeft(y).ticks(10, "s"))
            .append("text")
            .attr("x", 2)
            .attr("y", y(y.ticks(10).pop()))
            .attr("dy", "0.35em")
            .attr("text-anchor", "start")
            .attr("fill", "#000")
            .text("Price");

     chart.selectAll(".bar")
            .data(data)
            .enter().append("rect")
            .attr("class", "bar")
            .attr("x", function (d) {
              return x(d.title);
             })
            .attr("y", function (d) {
              return y(d.price);
             })
            .attr("height", function (d) {
              return height - y(d.price);
             })
            .attr("width", x.bandwidth());
    }
  </script>
</stockmarket-barchart>
In the same way we have done for the stockmarket-table, we use the opts object to inject the stocks we get from the Stockmarket API. But also the height and the width of the chart to be able to customize its size when declaring our component. As we wish only deal with the title and price we do transform the stocks into a data structure that is passed to our createChart() function.
You can note two things:
- first, we use some nice features of Ecmascript6 (… sorry, Javascript 2015) such as default parameters
- second, we plug the creation of the chart in one of the tag lifecycle hook we discussed in a previous blog post
this.on('mount', function() {
  var data = opts.stocks.map(s => {
    return {'title': s.title, 'price': s.price};
  });

  createChart(data, this.chartId, opts.height, opts.width);
});
The this.on(‘mount’, function() {…}); instructs Riot.js to create the chart at the insertion of the tag in the DOM.
Now, let’s add the style into a dedicated stylesheet stockmarket-barchart.css:
.bar {
    fill: steelblue;
}

.bar:hover {
    fill: brown;
}

.axis {
    font: 10px sans-serif;
}

.axis path {
    shape-rendering: crispEdges;
}
Hey! This time we have respected our guidelines: our webcomponent is a tag + a css!
At last, in our body of the index.html, we add:
<!doctype html>
<html lang="en">
<head>
  ...
  <link rel="stylesheet" type="text/css" href="css/stockmarket-barchart.css" />
</head>
<body>
  <!-- mount point -->
  ...
  <stockmarket-barchart height="500" width="960"></stockmarket-barchart>

  ...
  <script src="../dist/js/stockmarket-barchart.js"></script>

  <script>
    ...
    riot.mount('stockmarket-barchart', { title: 'Graph', stocks: stocks});
  </script>
</body>
Note something new: instead of passing the height and width of the chart in the function call riot.mount(.), we pass them as attributes of the tags. Passing them as attributes of the tag, add automatically them to its Riot.js opts object. Neat, isn’t it?
But there is a restriction in the naming: avoid CamelCase if you pass parameters as attributes. Instead, use a ‘_’ to separate the words. Would I have wanted to name ‘chartHeight’ instead of ‘height’ my parameter, it would have not worked. I should have named it ‘chart_height’ instead. This is due to some browser specification (see here).
Wish to display the same chart a bit smaller? Let’s declare another tag!
<body>
  <!-- mount point -->
  ...
  <stockmarket-barchart height="500" width="960"></stockmarket-barchart>
  <stockmarket-barchart height="300" width="760"></stockmarket-barchart>
  ...
  </body>
</html>
… and you get another chart, a bit smaller! The more I code with Riot.js, the more I like it! 🙂
Getting the stocks from the Stockmarket API
One more thing: we need to get the stocks from the Stockmarket API. To do so, we use an old classical XMLHttpRequest call. Once we get the result, we mount our Riot.js components:
    <!-- mount point -->
    <stockmarket-table></stockmarket-table>
    <stockmarket-barchart height="500" width="960"></stockmarket-barchart>
    <!-- <stockmarket-barchart height=300 width=760 chart_id="chart-2"></stockmarket-barchart> -->

    <!-- include riot.js and the compiler -->
    <script src="../node_modules/riot/riot.min.js"></script>

    <script src="../node_modules/d3/build/d3.min.js"></script>

    <script src="../dist/js/stockmarket-table.js"></script>
    <script src="../dist/js/stockmarket-barchart.js"></script>

    <script>
    var xhr = new XMLHttpRequest();
    var url = "http://stockmarket.streamdata.io/prices";

    xhr.onreadystatechange = function() {
        if (xhr.readyState == 4 && xhr.status == 200) {
            var stocks = JSON.parse(xhr.responseText);
            loadStockMarket(stocks);
        }
    }
    xhr.open("GET", url, true);
    xhr.send();

    function loadStockMarket(stocks) {
      riot.mount('stockmarket-table', { title: 'Stocks', stocks: stocks });
      riot.mount('stockmarket-barchart', { title: 'Graph', stocks: stocks});
    }
    </script>
  </body>
</html>
One last thing: calling directly the Stockmarket API from your localhost would have resulted in a nasty CORS error:
XMLHttpRequest cannot load http://stockmarket.streamdata.io/prices. No 'Access-Control-Allow-Origin' header is present on the requested resource. Origin 'http://localhost:3000' is therefore not allowed accessWant to prevent from that CORS error? You can either use an online proxy, one of the CORS chrome extensions or even build your own cors proxy server with cors-anywhere for example.
Conclusion
Now, we have settled the first step of our demo. From one set of data (the stocks), we manage to display it into different forms: a table and a graph. And it was quite easy thanks to Riot.js that enables us to develop independently UI components.
Ok. We have coded a really amazing app. Let’s take a breath and a drink before diving into Step 2. Just to recover from our emotions…
Oh, by the way, the code can be found on our GitHub (eventDrivenApp branch, tag step1).
Want more ?
Exploring Riot.js – Introduction
Exploring Riot.js – Get your hands dirty
Exploring Riot.js – Event-driven app (Step1) … you are here
Exploring Riot.js – Event-driven app (Step2)
Exploring Riot.js – Event-driven app (Step3)
Exploring Riot.js – En route to…
Exploring Riot.js – Route 66 (Takeaway)