

In my previous Amplify Whiteoboard articles, I covered an open API Management Plane and API Discovery and Subscriptions. Today, we cover API observability and traffic analytics.
API observability and traffic analytics
API traffic analytics provides a meaningful lens into the state of your applications. API analytics can help answer questions such as:
- How are my API consumptions trending over time?
- Which apps consume the most and least API traffic?
- Which APIs are fast, which APIs are slow?
- How many successes vs failures occur?
- Are errors coming from the server-side or the client-side?
When APIs are distributed across multiple API platforms, each providing its separate analytics, organizations are reduced to comparing apples and oranges and are missing out on the complete picture of their application health.
Out-of-band API traffic metadata capture
Amplify collects API traffic information via traceability agents. Each agent collects this data in its domain-specific way to be as efficient as possible.
Collecting this data should always be done out-of-band to avoid any added latency in your API traffic.
Although Amplify provides many traceability agent implementations for popular API platforms out of the box, Axway also provides an open-source SDK that lets organizations capture this data even in the most proprietary environments such as home-grown API platforms or heavily customized third-party platforms.
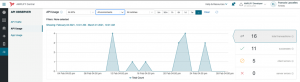
API analytics provided by API observer
Through its network of traceability agents, API observer aggregates API analytics from your various API platforms into a single pane of glass. API observer displays API and App usage that either combine total API volumes across environments or zooms into an individual environment or API.
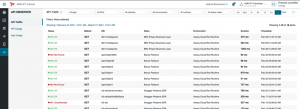
Peering into API transactions
API Observer also lets you peek into individual API transactions. From the API Traffic tab, you can choose which environment you want to look at API transactions for, you can filter on APIs, methods, status code and more than illustrated below. This helps troubleshoot application issues across your various API platforms.
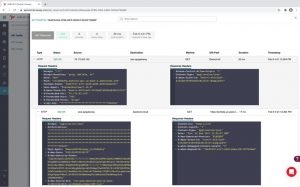
Transaction details and data privacy protection
Beyond the API traffic view, the API observer provides a detailed view for each API transaction as illustrated in the following API observer screenshot for an AWS-hosted API.
In this case, you can view header values included in the request and the response in addition to the basic API transaction characteristics.
In some cases, this level of detail is not warranted, or the values from those headers might contain private information that should not be propagated outside of the AWS domain in which they flow.
For such reasons, Amplify traceability lets you control on a per-environment level whether to include transaction details such as headers. This level of control is delegated to each API platform that connects to Amplify via the agents.
Letting each respective API platform admins opt-in (or not) for these details to be propagated to the centralized API Management Plane, you maintain confidence for what might otherwise be perceived as invasive data extraction and potential privacy breach.
In addition to the “opt-in” approach, traceability agents let you define specific elements that should be sanitized before the traffic information be shared with Amplify.
With this level of configuration, you can get the best of both worlds: detailed traffic information is visible in API Observer, yet private information is not exposed because of API tracing.
An open approach to API analytics
Amplify provides more open API analytics in the following ways:
- API traffic metadata is collected from all your API platforms, not just Amplify API Management
- Custom traceability agents can be built using the Amplify Agent SDK
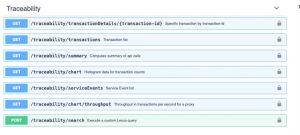
- The data collected and visualized in API observer can also be programmatically accessed via the Traceability Queries API.
Stay tuned for my next Whiteboard series article coming your way next week.
Don’t miss out. View the Whiteboard video today.