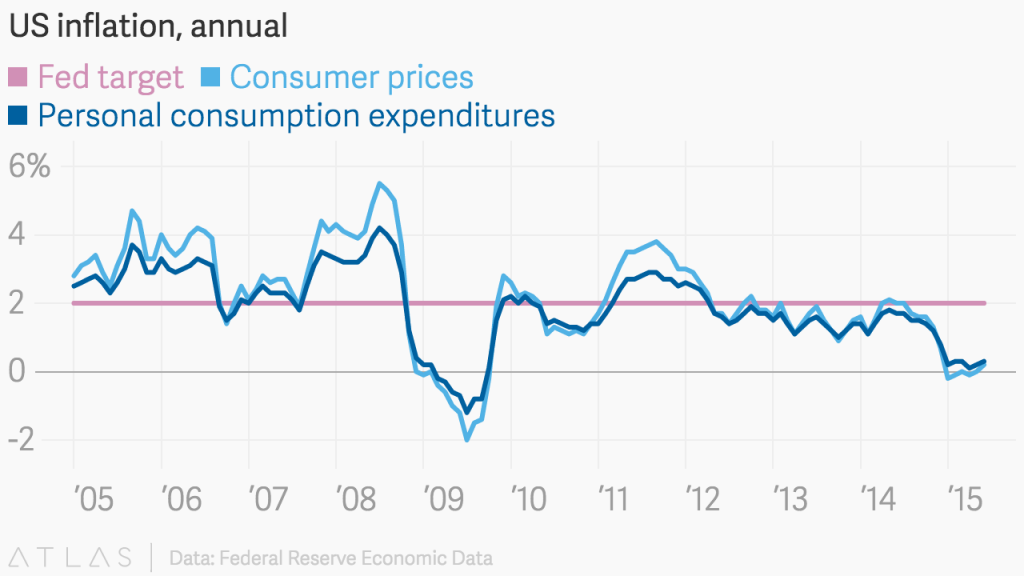
We are always on the lookout for useful sources of data that can easily be streamed, and included in the Streamdata.io API Gallery, and hopefully help generate interesting story ideas for the blog like this one. A process which helps us to find valuable resources like out of the Economic Research Division of the Federal Reserve Bank of St. Louis which has an API for getting at the Federal Reserve Economic Data (FRED®), and the Geographical Economic Data (GeofRED®) databases by source, release, region, category and series. Providing an interesting economic data API to look at how economic data gets released in the US.
We see two opportunities here. One is to stream events that occur around the release of economic data, as well as any documents, or machine readable data that are made available via each release. You can see an interesting example of a visual calendar of the economic data releases, and get at the data via the FRED API, and the GeoFRED API. It would take some extra work to get at all the documents, APIs, and data available within each release, but real time delivery of the economic data releases would make for a pretty good start. If for nothing else, just to understanding how frequently an economic data API is updated, would be useful.
The APIs out of the Federal Reserve Bank of St. Louis provide an interesting look at how economic data is being released, while also potentially providing access to a wealth of other statistics and real time economic data that can be included in applications, and use to train machine learning (ML) models. Once we’ve finishing profiling the APIs, and seeing how often data changes, we’ll get to work profiling each of their contributing data sources. If there are any of them you’d like to see us prioritize, please let us know. Last count there were 86 separate economic data sources available, so we’ll need to get to work.
